UML Use Case Diagram Example Social Networking Sites Project
UML Diagrams Social Networking Sites Project. This sample was created in ConceptDraw PRO diagramming and vector drawing software using the UML Use Case Diagram library of the Rapid UML Solution from the Software Development area of ConceptDraw Solution Park. This sample shows the Facebook Socio-health system and is used at the projection and creating of the social networking sites.
 Fishbone Diagrams
The Fishbone Diagrams solution extends ConceptDraw PRO v10 software with the ability to easily draw the Fishbone Diagrams (Ishikawa Diagrams) to clearly see the cause and effect analysis and also problem solving. The vector graphic diagrams produced using this solution can be used in whitepapers, presentations, datasheets, posters, and published technical material.
Cloud Computing Architecture Diagrams
For documenting the Cloud Computing Architecture with a goal to facilitate the communication between stakeholders are successfully used the Cloud Computing Architecture diagrams. It is convenient and easy to draw various Cloud Computing Architecture diagrams in ConceptDraw PRO software with help of tools of the Cloud Computing Diagrams Solution from the Computer and Networks Area of ConceptDraw Solution Park.Data Flow Diagram Examples
Data flow diagrams (DFDs) are effective to reveal relationships among the various components in a program or system. This type of diagrams is an important and useful technique for modeling an information system, its process aspects, for showing a system as a single high-level process. DFD lets illustrate the flow of data, how the input data are transformed to output results across the sequence of functional transformations. DFD consists of four major components: entities, processes, data stores, data flows. When you need to draw a Data Flow Diagram the ConceptDraw PRO diagramming and vector drawing software extended with Data Flow Diagrams solution will be helpful for you. Providing numerous collection of Data Flow Diagram examples, samples, templates and ready-to-use vector DFD symbols, Data Flow Diagrams solution ensures you with all needed tools for easy designing DFDs according to Gane-Sarson or Yourdon-Coad notation on your choice. Any from offered predesigned DFD examples can become a perfect base for your own diagram.
 Fishbone Diagram
Fishbone Diagrams solution extends ConceptDraw PRO software with templates, samples and library of vector stencils for drawing the Ishikawa diagrams for cause and effect analysis.
UML Deployment Diagram Example - ATM System UML diagrams
The UML Deployment Diagram is used for visualization of elements and components of a program, that exist at the stage of its execution. It contains graphical representations of processors, devices, processes, and relationships between them. The UML Deployment Diagram allows to determine the distribution of system components on its physical nodes, to show the physical connections between all system nodes at the stage of realization, to identify the system bottlenecks and reconfigure its topology to achieve the required performance. The UML Deployment diagram is typically developed jointly by systems analysts, network engineers and system engineers. ConceptDraw PRO diagramming and vector drawing software with Rapid UML solution from Software Development area of ConceptDraw Solution Park perfectly suits for designing different types of UML diagrams, including the UML Deployment Diagrams. There are included a lot of design elements, templates, examples and samples, among them an example of work of ATM (Automated Teller Machine) banking system.Draw Network Diagram based on Templates and Examples
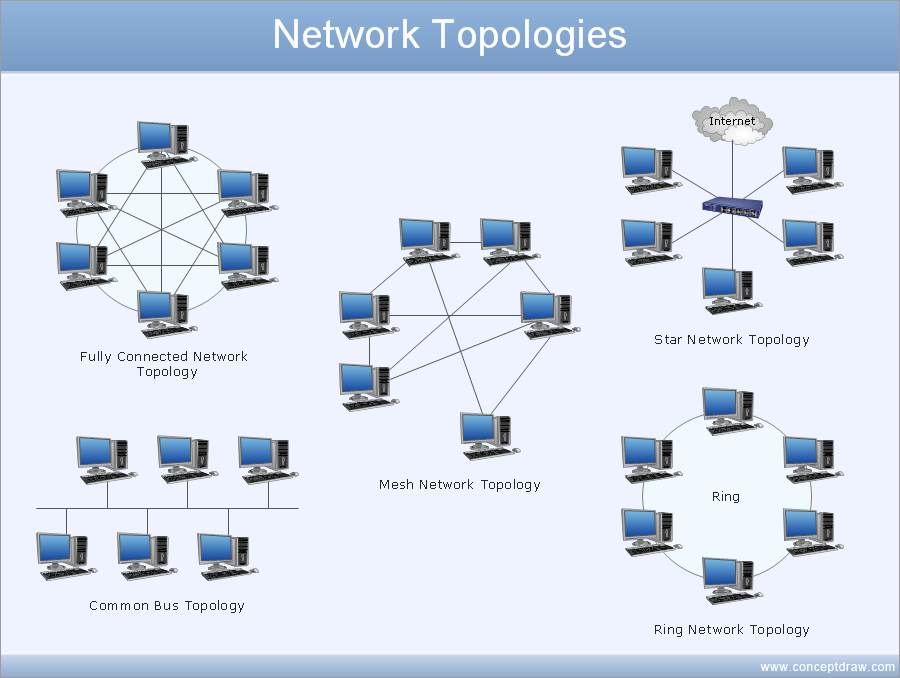
ConceptDraw is rapid and powerful network diagram drawing software with rich examples, templates, design objects and stencils.
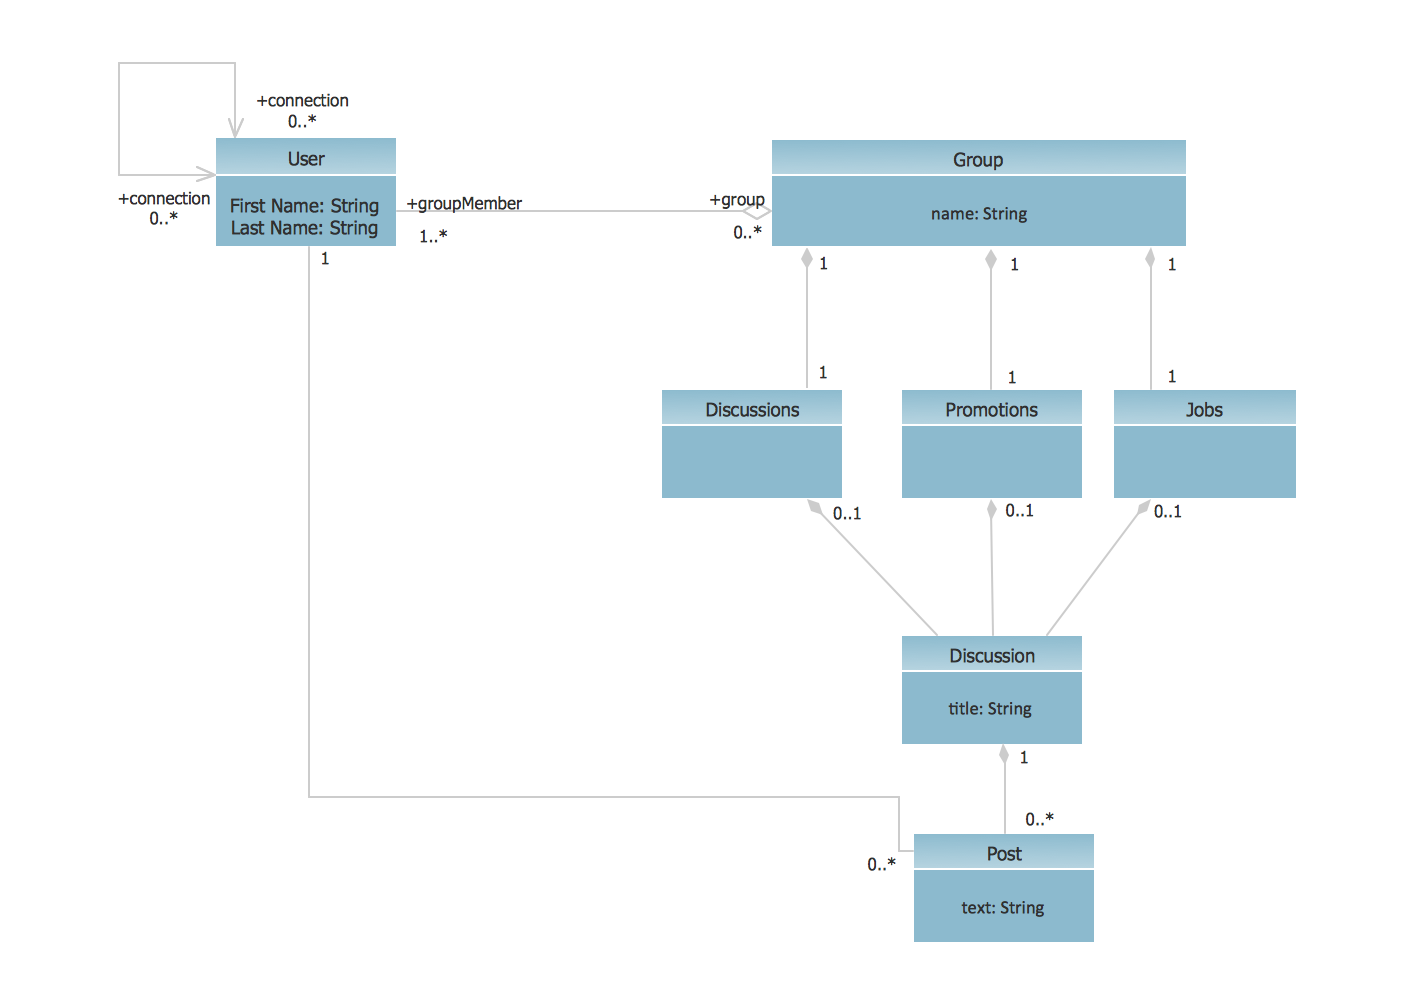
UML Class Diagram Example - Social Networking Site
UML Diagrams Social Networking Sites Project. This sample was created in ConceptDraw PRO diagramming and vector drawing software using the UML Class Diagram library of the Rapid UML Solution from the Software Development area of ConceptDraw Solution Park. This sample shows the structure of the popular social networking site Linkedin and is used in the business field, in IT, at the projection and creating of the social networking sites.Cross-Functional Flowchart
Use of Cross-Functional Flowchart is a clear way of showing each team member’s responsibilities and how processes get shared or transferred between different responsible people, teams and departments. Use the best flowchart maker ConceptDraw PRO with a range of standardized cross-functional flowchart symbols to create the Cross-Functional Flowcharts simply and to visualize the relationship between a business process and the functional units responsible for that process. To draw the most quickly Cross-Functional Flowcharts, Cross Functional Process Maps, or Cross Functional Process Flow Diagrams, start with a Cross-functional flowchart samples and templates from ConceptDraw Solution Park. The ConceptDraw Arrows10 and RapidDraw technologies will be also useful for you in drawing. ConceptDraw PRO supports designing both types - horizontal and vertical Cross-functional flowcharts. A vertical layout makes the accents mainly on the functional units while a horizontal layout - on the process. If you need a Visio alternative in Mac OS X, try ConceptDraw PRO. Its interface is very intuitive and it’s actually much easier to use than Visio, yet somehow it’s just as powerful if not more so. ConceptDraw PRO performs professional quality work and seamless Visio interaction.
 Event-driven Process Chain Diagrams
Event-driven Process Chain (EPC) Diagram is a type of flowchart widely used for modeling in business engineering and reengineering, business process improvement, and analysis. EPC method was developed within the Architecture of Integrated Information Systems (ARIS) framework.
UML Activity Diagram
UML Activity Diagram is a type of UML diagrams, which illustrates the business and operational step-by-step workflows of components within a system and shows the overall flow of control. UML Activity Diagram is constructed from a limited number of shapes, connected each other with arrows. The most important shape types are rounded rectangles, diamonds, bars, black circle, encircled black circle. The arrows represent the order in which activities happen and run from the start towards the end. ConceptDraw PRO software enhanced with Rapid UML solution is ideal for software designers and software developers who need to draw the UML Activity Diagrams and other types of UML diagrams. It is convenient to use the appropriate stencils of UML notation from the UML Activity library included to the Rapid UML solution of ConceptDraw Solution Park and containing a lot of specific vector UML objects. Use them to design your own UML Activity Diagrams, make them colorful and attractive with style tools of ConceptDraw PRO software.UML Deployment Diagram
UML Deployment Diagram depicts the physical deployment of artifacts on nodes (nodes are the existing hardware components, artifacts are the software components running on each node); and how the different pieces are connected. Use ConceptDraw PRO with UML deployment diagram templates, samples and stencil library from Rapid UML solution to model the physical deployment of artifacts on nodes of your software system.
 ConceptDraw Dashboard for Facebook
ConceptDraw Dashboard for Facebook solution extends ConceptDraw PRO software with a dynamically updated visual dashboard, which shows lifetime total likes, daily friends of fans, and daily page views, information you can receive from Facebook Insights.
- UML Use Case Diagram Example Social Networking Sites Project ...
- UML Use Case Diagram Example Social Networking Sites Project ...
- ConceptDraw Dashboard for Facebook | UML Use Case Diagram ...
- UML Use Case Diagram Example Social Networking Sites Project ...
- ConceptDraw Dashboard for Facebook | UML Use Case Diagram ...
- UML Use Case Diagram Example Social Networking Sites Project ...
- ConceptDraw Dashboard for Facebook | UML Use Case Diagram ...
- UML Use Case Diagram Example Social Networking Sites Project ...
- UML Use Case Diagram Example Social Networking Sites Project ...
- UML Use Case Diagram Example Social Networking Sites Project ...
- UML Use Case Diagram Example Social Networking Sites Project ...
- UML Use Case Diagram Example Social Networking Sites Project ...
- UML Use Case Diagram Example Registration System | Financial ...
- UML Use Case Diagram Example Social Networking Sites Project ...
- UML Use Case Diagram Example Social Networking Sites Project ...
- ConceptDraw Dashboard for Facebook | Venn Diagram Examples ...
- UML Use Case Diagram Example Social Networking Sites Project ...
- UML Use Case Diagram Example Social Networking Sites Project ...
- UML Use Case Diagram Example Social Networking Sites Project ...
- UML Use Case Diagram Example Social Networking Sites Project ...


