"San Francisco ..., officially the City and County of San Francisco, is the leading financial and cultural center of Northern California and the San Francisco Bay Area.
The only consolidated city-county in California, San Francisco encompasses a land area of about 46.9 square miles (121 km2) on the northern end of the San Francisco Peninsula, giving it a density of about 17,620 people per square mile (6,803 people per km2). It is the most densely settled large city (population greater than 200,000) in the state of California and the second-most densely populated major city in the United States after New York City. San Francisco is the fourth most populous city in California, after Los Angeles, San Diego and San Jose, and the 14th most populous city in the United States—with a Census-estimated 2012 population of 825,863. The city is also the financial and cultural hub of the larger San Jose-San Francisco-Oakland metropolitan area, with a population of 8.4 million." [San Francisco. Wikipedia]
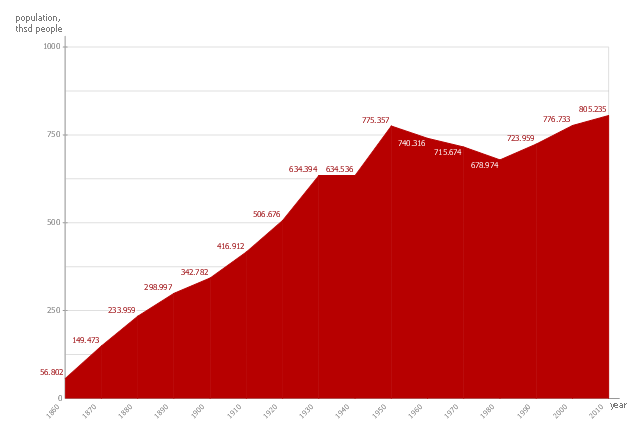
The area chart example "San Francisco population history" was created using the ConceptDraw PRO diagramming and vector drawing software extended with the Area Charts solution from the Graphs and Charts area of ConceptDraw Solution Park.
 Area Charts
Area Charts are used to display the cumulative totals over time using numbers or percentages; or to show trends over time among related attributes. The Area Chart is effective when comparing two or more quantities. Each series of data is typically represented with a different color, the use of color transparency in an object’s transparency shows overlapped areas and smaller areas hidden behind larger areas.
- Area chart - San Francisco population history | - Conceptdraw.com
- Area Charts | Area chart - San Francisco population history | Area ...
- Line Chart Examples | Line chart - Evolution of the population | Area ...
- Picture graph - Population growth by continent, 2010 - 2013 | Line ...
- Financial Comparison Chart | Bar Diagrams for Problem Solving ...
- Line Chart Examples | Basic Diagramming | Area Charts |
- Picture graph - Population growth by continent, 2010 - 2013 | Basic ...
- Picture graph - Population growth by continent, 2010 - 2013 | Basic ...
- Line Chart Examples | Chart Examples | Picture graph - Population ...
- Bar Diagrams for Problem Solving. Create economics and financial ...
- Basic Diagramming | Picture Graphs | - Conceptdraw.com
- Basic Diagramming | Geo Map - Asia | - Conceptdraw.com
- Basic Diagramming | Line Chart Examples | Geo Map - Australia ...
- Basic Diagramming |
- Line Chart Examples | Chart Examples | Picture Graphs |
- Basic Diagramming |
- Basic Diagramming |
- Line chart - Evolution of the population | Line Chart Examples | Basic ...
- Global competitiveness index infrastructure score chart, 2012 -2013
- Pyramid Diagram and Pyramid Chart | Baseball | AWS Architecture ...
