Scatter Chart Examples
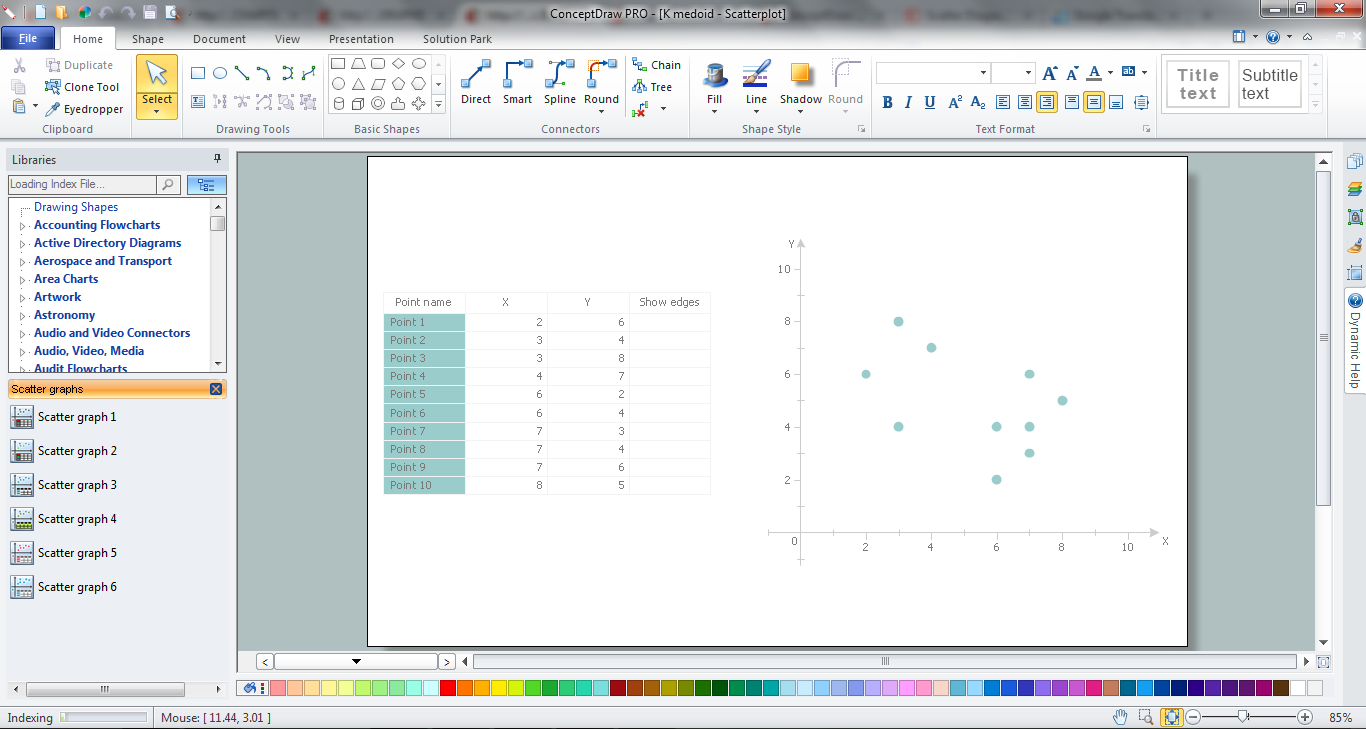
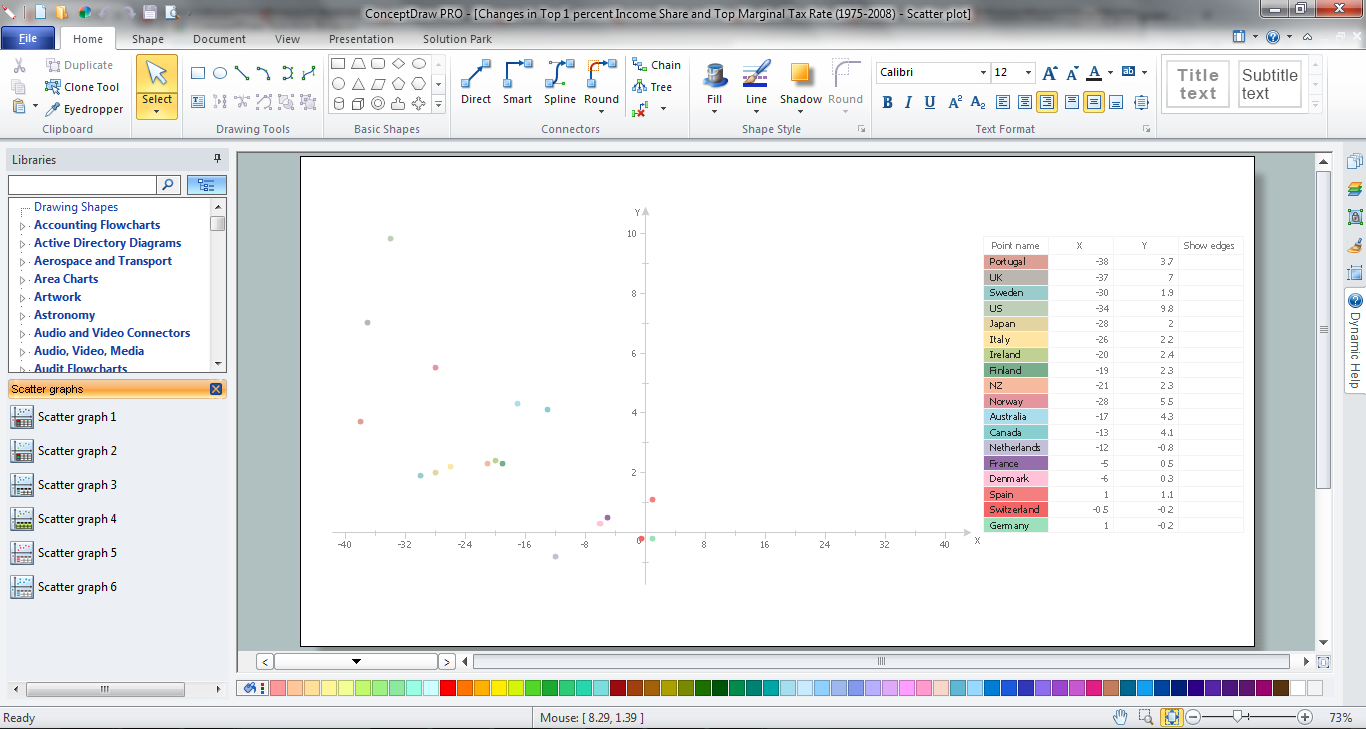
The Line Graphs solution from Graphs and Charts area of ConceptDraw Solution Park contains a set of examples, templates and design elements library of scatter charts. Use it to draw scatter graphs using ConceptDraw PRO diagramming and vector drawing software for illustrating your documents, presentations and websites.Scatter Graph Charting Software
ConceptDraw provides some interactive xy chart and scatter graph symbols that offers advanced features yet is simple to use.Scatter Graph
You've got to draw the Scatter Graph and look for the convenient tool which will help you? Direct your attention on the ConceptDraw PRO diagramming and vector drawing software extended with Scatter Diagrams Solution from the Graphs and Charts Area.Scatter Chart
A Scatter Chart is a type of diagram which represents the data set as a collection of points in Cartesian coordinates. Each point is determined by the values of two variables. ConceptDraw PRO offers the Scatter Diagrams solution from the Graphs and Charts Area of ConceptDraw Solution Park. It's the best choice when you need create professional looking Scatter Chart.Chart Software for Better Presentations
Easy charting software comes with beautiful chart templates and examples. This makes it easy to create professional charts without prior experience. Graphs and Charts Area provide a wide collection of professional looking predesigned templates, samples and ready-to-use vector stencils that will help you to draw the charts and diagrams of various types: Pie Charts, Donut Charts, Line Charts, Column Charts, Bar Charts, Pyramids, Scatter Charts, Venn Diagrams, Spider Charts, Area Charts, Divided Bar Graphs.Line Graph Charting Software
To design line and scatter charts use ConceptDraw PRO diagramming and vector drawing software extended with Line Graphs solution from Graphs and Charts area of ConceptDraw PRO Solution Park. (Line chart, scatter chart, 2d chart).Make a Scatter Plot
ConceptDraw PRO diagramming and vector drawing software offers the Scatter Diagrams Solution from the Graphs and Charts Area to make a Scatter Plot creating fast and simple.Polar Graph
This sample shows the Polar Graph. The Polar Graph is a graph in the polar coordinate system in which the each point on the plane is defined by two values - the polar angle and the polar radius. The certain equations have very complex graphs in the Cartesian coordinates, but the application of the polar coordinate system allows usually produce the simple Polar Graphs for these equations.Scatter Plot
ConceptDraw PRO extended with Scatter Diagrams solution is ideal diagramming and vector drawing software for quick and easy designing professional looking Scatter Plot.Chart Templates
Easy charting software comes with beautiful chart templates and examples. This makes it easy to create professional charts without prior experience.Chart Examples
Easy charting software comes with beautiful chart templates and examples. This makes it easy to create professional charts without prior experience.Bar Diagrams for Problem Solving. Create manufacturing and economics bar charts with Bar Graphs Solution
Create bar charts for visualizing problem solving in manufacturing and economics using the ConceptDraw PRO diagramming and vector drawing software extended with the Bar Graphs Solution from the Graphs and Charts area of ConceptDraw Solition Park.Accounting Data Flow from the Accounting Flowcharts Solution
Accounting Data Flow from the Accounting Flowcharts Solution visually describes the financial accounting process, shows the accumulated information about transactions and events for creating the balance sheet and the final income statement. Accounting Flowcharts Solution contains also a wide variety of templates and samples that you can use as the base for your own Accounting Flowcharts of any complexity.Account Flowchart Stockbridge System. Flowchart Examples
Create your own flow charts of data processing systems using the ConceptDraw PRO diagramming and vector drawing software extended with the Cross-Functional Flowcharts solution from the Business Processes area of ConceptDraw Solution Park. This is a flowchart of a data processing system combining manual and computerized processing to handle accounts receivable, billing, and general ledger.Flowchart of Products. Flowchart Examples
This sample shows the Flowchart of the Sustainment and Disposal. A Flowchart is a graphically representation of the process that step-by-step lead to the solution the problem. The geometric figures on the Flowchart represent the steps of the process and are connected with arrows that show the sequence of the actions. The Flowcharts are widely used in engineering, architecture, science, analytics, government, politics, business, marketing, manufacturing, administration, etc.- Chart Templates | Scatter Chart Examples | Chart Examples | Plot ...
- Blank Scatter Plot | Scatter Graph Charting Software | Create a ...
- Accounting Flowchart Symbols | Basic Scatter Diagrams | Bar Chart ...
- Map of median household income in Australia | Shares of aggregate ...
- Percentage Pie Chart . Pie Chart Examples | Percentage of the top 1 ...
- Scatter plot with missing categories | Scatter Diagrams | Scatter ...
- Income Statement Flow Chart
- How to Draw a Line Graph | France exports of goods and services ...
- Scatter Graph Charting Software | Flow Chart Symbols | Sales ...
- Chart Maker for Presentations | Chart Software for Better ...
- Empty Scatter Plot Graph
- Blank Scatter Plot Graph
- Scatter Plot | Modern Garden Design | How To use Landscape ...
- Create a Presentation Using a Design Template | How to Create a ...
- Line Graph Charting Software | How to Draw a Line Graph | Basic ...
- Line Chart Examples | Line Graphs | How to Draw a Line Graph ...
- Chart Maker for Presentations | How to Draw a Line Graph | Line ...
- Bar Graphs | How to Draw a Line Graph | Line Graphs | Graph
- Area Charts | Basic Area Charts | Examples of Flowcharts, Org ...


