How to Create a Scatter Chart
Simple tutorial help you learn how to draw a scatter chart and increase you possibilities of understanding and work more effective with our scatter chart software.Scatter Graph
You've got to draw the Scatter Graph and look for the convenient tool which will help you? Direct your attention on the ConceptDraw PRO diagramming and vector drawing software extended with Scatter Diagrams Solution from the Graphs and Charts Area.Scatter Diagram
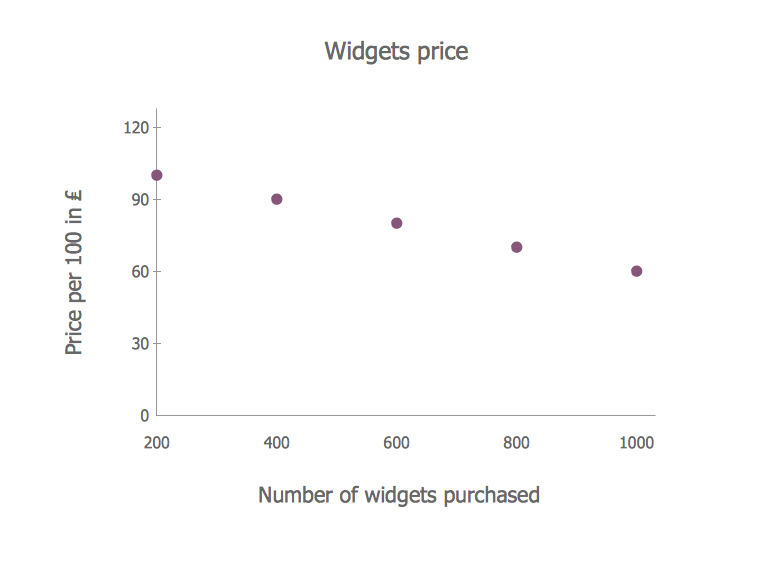
This sample shows the scatter diagram that displays the inverse correlation. The correlation measures the strength of association among two variables. You can see that when the number of widgets increases, the price per 100 widgets decreases. Using the ready-to-use objects from the Line Graphs Solution for ConceptDraw PRO you can create your own professional looking Scatter Charts quick and easy.Competitor Analysis
Competitor analysis is a first and obligatory step in elaboration the proper corporate marketing strategy and creating sustainable competitive advantage. Use powerful opportunities of numerous solutions from ConceptDraw Solution Park for designing illustrative diagrams, charts, matrices which are necessary for effective competitor analysis.Scatter Chart
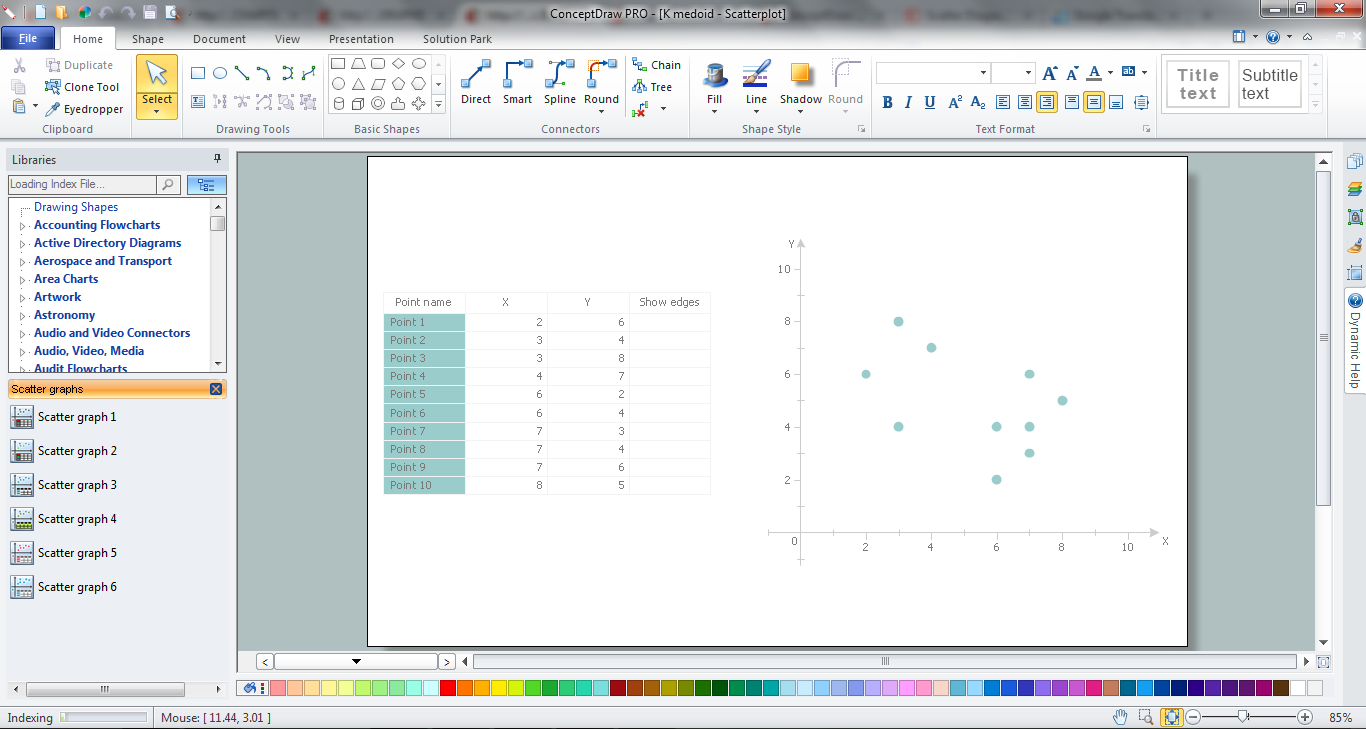
A Scatter Chart is a type of diagram which represents the data set as a collection of points in Cartesian coordinates. Each point is determined by the values of two variables. ConceptDraw PRO offers the Scatter Diagrams solution from the Graphs and Charts Area of ConceptDraw Solution Park. It's the best choice when you need create professional looking Scatter Chart.The Best Flowchart Software Available
ConceptDraw gives the ability to draw Flowchart documents. Flowcharts solutionis a powerful tool that extends ConceptDraw application for drawing business flowcharts. ConceptDraw PRO vector diagramming and business graphics software enhanced with with templates, green and interactive flowchart makers, samples and stencil libraries from ConceptDraw Solution Park which all focused to help with drawing flowcharts, block diagrams, bar charts, histograms, pie charts, divided bar diagrams, line graphs, area charts, scatter plots, circular arrows diagrams, Venn diagrams, bubble diagrams, concept maps, and others.
Visual Presentations Made Easy with Diagramming Software
Automatically create a presentation-quality diagram in one click with ConceptDraw PRO.
Basic Flowchart Symbols and Meaning
Flowcharts are the best for visually representation the business processes and the flow of a custom-order process through various departments within an organization. ConceptDraw PRO diagramming and vector drawing software extended with Flowcharts solution offers the full set of predesigned basic flowchart symbols which are gathered at two libraries: Flowchart and Flowcharts Rapid Draw. Among them are: process, terminator, decision, data, document, display, manual loop, and many other specific symbols. The meaning for each symbol offered by ConceptDraw gives the presentation about their proposed use in professional Flowcharts for business and technical processes, software algorithms, well-developed structures of web sites, Workflow diagrams, Process flow diagram and correlation in developing on-line instructional projects or business process system. Use of ready flow chart symbols in diagrams is incredibly useful - you need simply drag desired from the libraries to your document and arrange them in required order. There are a few serious alternatives to Visio for Mac, one of them is ConceptDraw PRO. It is one of the main contender with the most similar features and capabilities.
The Best Drawing Program for Mac
ConceptDraw PRO is the professional business graphic software for drawing diagrams and charts with great visual appeal on Mac OS X.Chart Templates
Easy charting software comes with beautiful chart templates and examples. This makes it easy to create professional charts without prior experience.Chart Examples
Easy charting software comes with beautiful chart templates and examples. This makes it easy to create professional charts without prior experience.Best Program to Create a Fowchart
ConceptDraw - feature-rich flowchart software allows you create professional looking flowcharts.Flowchart Example: Flow Chart of Marketing Analysis
An example flowchart of marketing analysis shows main steps you have to challenge writing a marketing analysis.Scatter Graph Charting Software
ConceptDraw provides some interactive xy chart and scatter graph symbols that offers advanced features yet is simple to use.- Scatter Graph Charting Software | Scatter Chart Examples | Scatter ...
- Scatter Diagrams | How to Draw a Scatter Diagram Using ...
- Audit Flowchart Symbols | Scatter Graph Charting Software | SDL ...
- Scatter Diagrams | ConceptDraw Solution Park | Value Stream ...
- Scatter Diagram In Tqm
- Blank Scatter Plot | Probability Quality Control Tools | Workflow ...
- Scatter Diagrams | Scatter Graph | Scatter Graph Charting Software ...
- Scatter Chart Examples | Blank Scatter Plot | The Best Drawing ...
- Scatter Diagrams | Blank Scatter Plot | How to Draw a Scatter ...
- Scatter Diagrams | Scatter Graph | Scatter Chart Examples | Scatter ...
- Total Quality Management TQM Diagrams | Visual Presentations ...
- Scatter Diagrams | Scatter Graph Charting Software | Scatter Graph ...
- Design elements - Scatter graphs | Scatter graphs - Vector stencils ...
- Scatter Graph Charting Software | Scatter Plot Graph | Scatter Chart ...
- Scatter Diagrams | Scatter Diagram | Correlation Dashboard ...
- Scatter Graph Charting Software | Sample Pictorial Chart. Sample ...
- Spider Chart Template | Flowchart Software | Blank Scatter Plot ...
- Block diagram - Marketing targeting | Target market | Scatter Chart ...
- Scatter Chart Examples | Four Dimensions Bubble Plot | Blank ...


