This scatter graphs (scattergraph. scatter chart, scatter plot, scatterplot, scatter diagram) sample show how the scatter plot with missing categories on the left,
the growth appears to be more linear with less variation. It was designed on the base of the Wikimedia Commons files: Scatter Plot with missing categories.svg [commons.wikimedia.org/ wiki/ File:Scatter_ Plot_ with_ missing_ categories.svg], and A scatter plot without missing categories.svg [commons.wikimedia.org/ wiki/ File:A_ scatter_ plot_ without_ missing_ categories.svg].
This file is available under the Creative Commons CC0 1.0 Universal Public Domain Dedication. [creativecommons.org/ publicdomain/ zero/ 1.0/ deed.en]
"In statistics, a misleading graph, also known as a distorted graph, is a graph that misrepresents data, constituting a misuse of statistics and with the result that an incorrect conclusion may be derived from it.
Graphs may be misleading through being excessively complex or poorly constructed. Even when constructed to accurately display the characteristics of their data, graphs can be subject to different interpretation. ...
Graphs created with omitted data remove information from which to base a conclusion. ...
In financial reports, negative returns or data that do not correlate a positive outlook may be excluded to create a more favorable visual impression." [Misleading graph. Wikipedia]
The chart example "Scatter plot with missing categories" was created using the ConceptDraw PRO diagramming and vector drawing software extended with the Scatter Diagrams solution from the Graphs and Charts area of ConceptDraw Solution Park.
 Scatter Diagrams
The Scatter Diagrams solution extends ConceptDraw PRO v10 functionality with templates, samples, and a library of vector stencils that make construction of a Scatter Plot easy. The Scatter Chart Solution makes it easy to design attractive Scatter Diagrams used in various fields of science, work, and life activities. ConceptDraw PRO lets you enter the data to the table and construct the Scatter Plot Graph automatically according to these data.
Scatter Chart Examples
The Line Graphs solution from Graphs and Charts area of ConceptDraw Solution Park contains a set of examples, templates and design elements library of scatter charts. Use it to draw scatter graphs using ConceptDraw PRO diagramming and vector drawing software for illustrating your documents, presentations and websites.Blank Scatter Plot
This sample shows the Scatter Plot without missing categories. It’s very important to no miss the data, because this can have the grave negative consequences. The data on the Scatter Chart are represented as points with two values of variables in the Cartesian coordinates. This sample can be used in the engineering, business, statistics, analytics, at the creating the financial and other types of reports.Scatter Plot
ConceptDraw PRO extended with Scatter Diagrams solution is ideal diagramming and vector drawing software for quick and easy designing professional looking Scatter Plot.Scatter Diagram
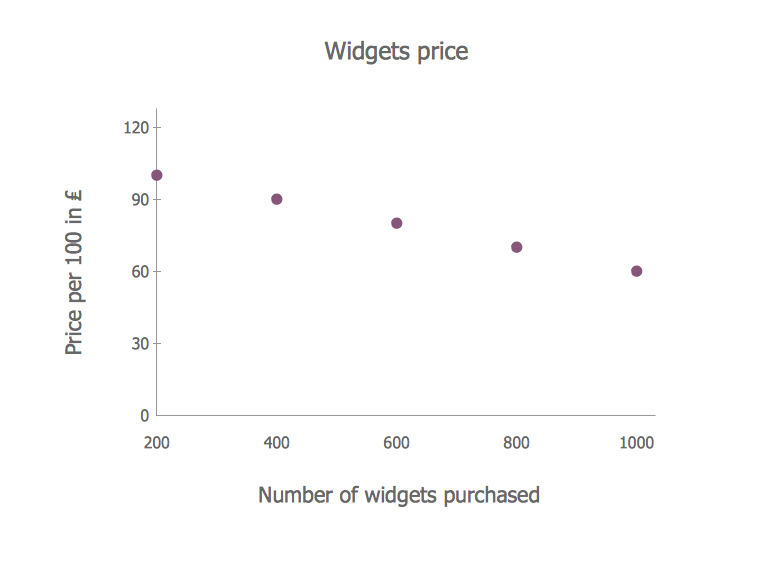
This sample shows the scatter diagram that displays the inverse correlation. The correlation measures the strength of association among two variables. You can see that when the number of widgets increases, the price per 100 widgets decreases. Using the ready-to-use objects from the Line Graphs Solution for ConceptDraw PRO you can create your own professional looking Scatter Charts quick and easy.The Best Flowchart Software Available
ConceptDraw gives the ability to draw Flowchart documents. Flowcharts solutionis a powerful tool that extends ConceptDraw application for drawing business flowcharts. ConceptDraw PRO vector diagramming and business graphics software enhanced with with templates, green and interactive flowchart makers, samples and stencil libraries from ConceptDraw Solution Park which all focused to help with drawing flowcharts, block diagrams, bar charts, histograms, pie charts, divided bar diagrams, line graphs, area charts, scatter plots, circular arrows diagrams, Venn diagrams, bubble diagrams, concept maps, and others.
Best Diagramming
Need to draw a diagram, process chart, flowchart, organizational chart, graphic design? ConceptDraw can help you to make professional graphic documents quickly.
Bar Graph
You need to draw the Bar Graph? The automated tool can be useful for you. ConceptDraw PRO diagramming and vector drawing software extended with Bar Graphs solution from Graphs and Charts area of ConceptDraw Solution Park will help you create any Bar Graph.Accounting Data Flow from the Accounting Flowcharts Solution
Accounting Data Flow from the Accounting Flowcharts Solution visually describes the financial accounting process, shows the accumulated information about transactions and events for creating the balance sheet and the final income statement. Accounting Flowcharts Solution contains also a wide variety of templates and samples that you can use as the base for your own Accounting Flowcharts of any complexity.IDEF0 Visio
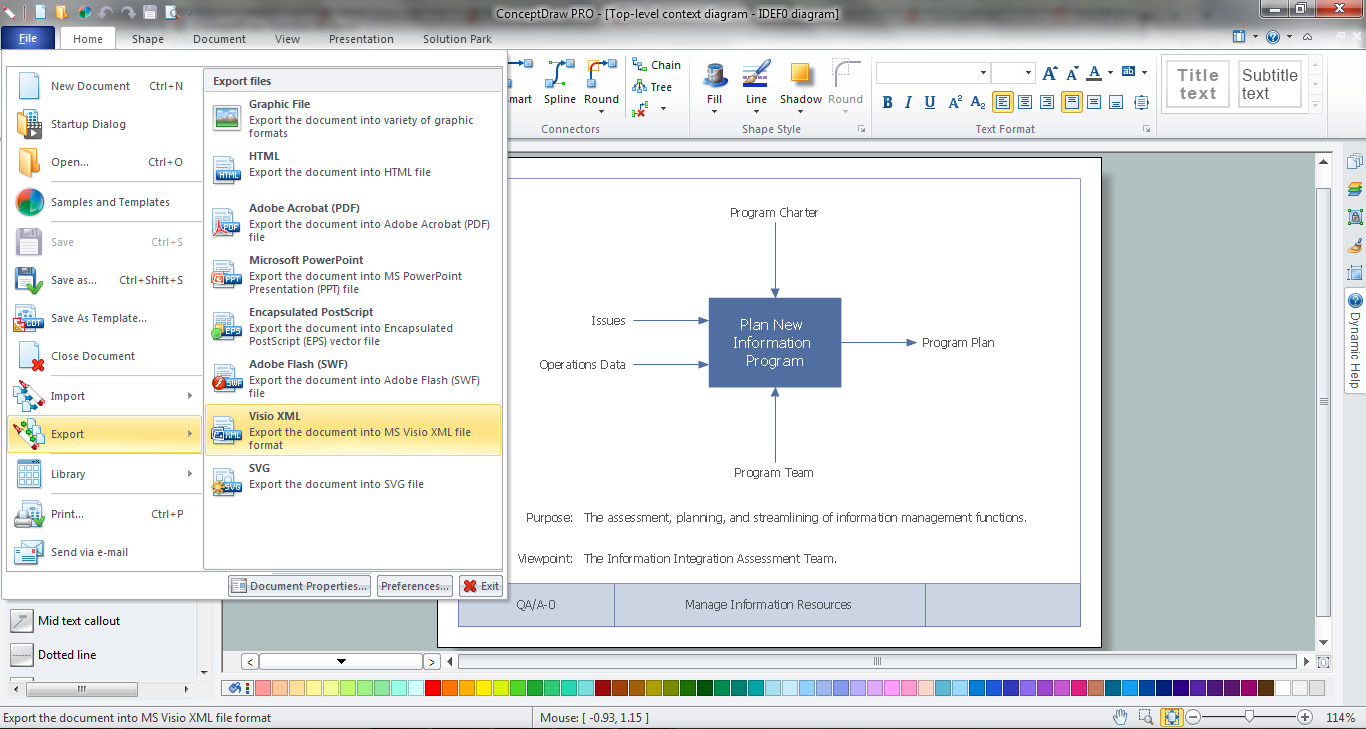
ConceptDraw PRO extended with IDEF0 Diagrams solution from the Software Development area of ConceptDraw Solution Park is a powerful diagramming and vector drawing IDEF0 software. All IDEF0 diagrams created in ConceptDraw PRO are vector graphic documents and can be reviewed, modified and converted to MS Visio XML format. To obtain the IDEF0 Visio documents from ConceptDraw PRO documents use the wide export possibilities of ConceptDraw PRO.Economic Calendar
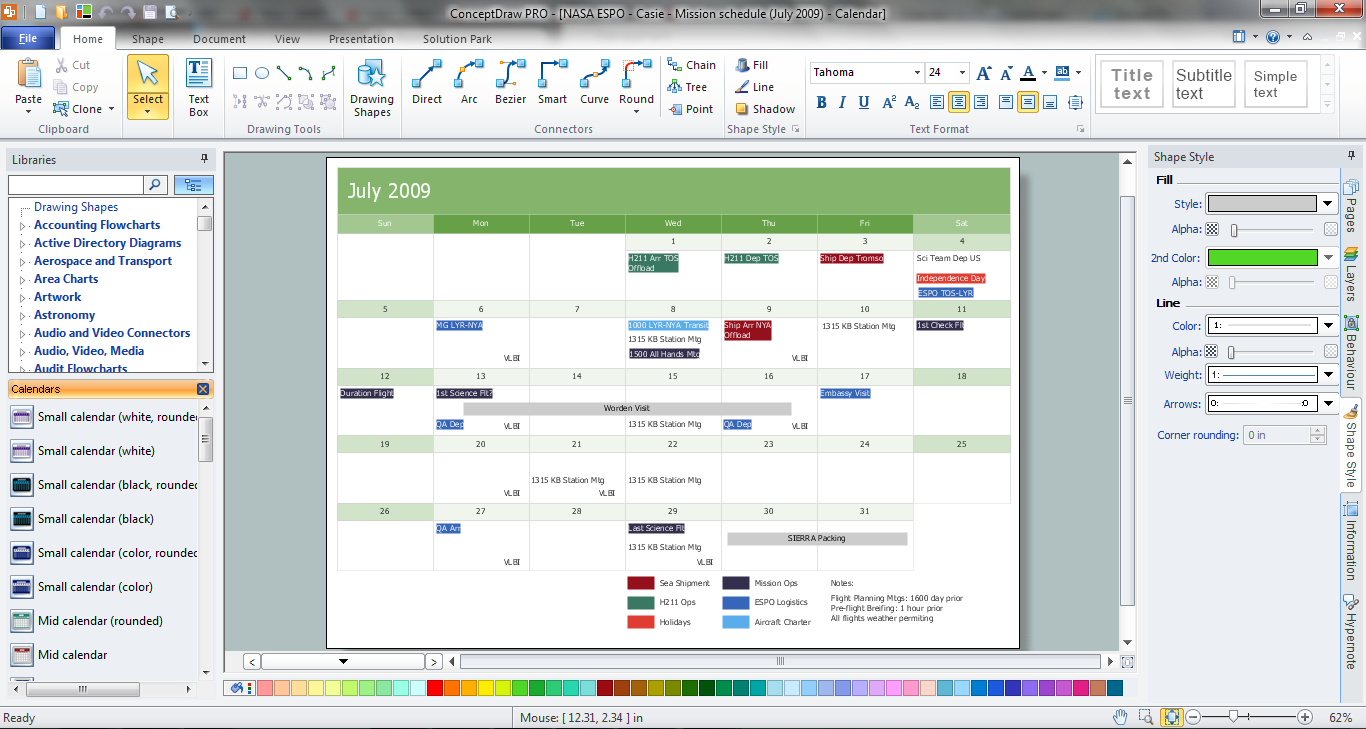
The economic calendar is a convenient way to display the economic events, the situation on the financial markets, it is a handy tool to keep track the chronology and dynamics of important events in the economy. But how design an economic calendar? ConceptDraw PRO extended with Calendars Solution from the Management Area is a useful, convenient and effective software for quick and easy design professional looking and attractive economic calendars.
 Project Exchange
This solution extends ConceptDraw PROJECT and ConceptDraw MINDMAP software with the ability to import and export project data.
 Fishbone Diagram
Fishbone Diagrams solution extends ConceptDraw PRO software with templates, samples and library of vector stencils for drawing the Ishikawa diagrams for cause and effect analysis.
 Value Stream Mapping
Value stream mapping solution extends ConceptDraw PRO software with templates, samples and vector stencils for drawing the Value Stream Maps (VSM) in lean manufacturing practice.
- Scatter Diagrams | How to Draw a Scatter Diagram Using ...
- Blank Scatter Plot | Scatter Diagrams | How to Draw a Scatter ...
- Scatter Chart Examples | Blank Scatter Plot | How to Draw a Scatter ...
- Scatter Chart Examples | Blank Scatter Plot | Scatter Chart Analysis ...
- How to Draw a Scatter Diagram Using ConceptDraw PRO | Scatter ...
- Blank Scatter Plot | Scatter Graph Charting Software | Create a ...
- Scatter Diagrams Solution
- Scatter Plot | Blank Scatter Plot | Design elements - Scatterplot ...
- Scatter Chart Examples | How to Draw a Scatter Diagram Using ...
- Blank Scatter Plot Graph
- Bubble Plot | Spider Chart Template | Blank Scatter Plot | Plot ...
- Blank Scatter Plot | Scatter Chart Examples | Scatter Graph Charting ...
- Scatter Chart Examples | Scatter Diagram | Blank Scatter Plot ...
- Blank Scatter Plot | Scatter Chart Examples | Four Dimensions ...
- Scatter Graph Charting Software | Scatter Chart Examples | Blank ...
- Scatter Chart Examples | Scatter Plot Graph | Scatter Graph Charting ...
- Scatter Graph Charting Software | Scatter Plot Graph | Scatter Chart ...
- How to Draw a Scatter Diagram Using ConceptDraw PRO | Scatter ...
- Scatter Chart Examples | Scatter graph - Template | Scatter graphs ...
- Scatter Chart Analysis. Scatter Chart Example | Scatter Chart ...


