Scatter Chart Examples
The Line Graphs solution from Graphs and Charts area of ConceptDraw Solution Park contains a set of examples, templates and design elements library of scatter charts. Use it to draw scatter graphs using ConceptDraw PRO diagramming and vector drawing software for illustrating your documents, presentations and websites.Chart Templates
Easy charting software comes with beautiful chart templates and examples. This makes it easy to create professional charts without prior experience.Best Diagramming
Need to draw a diagram, process chart, flowchart, organizational chart, graphic design? ConceptDraw can help you to make professional graphic documents quickly.
Blank Scatter Plot
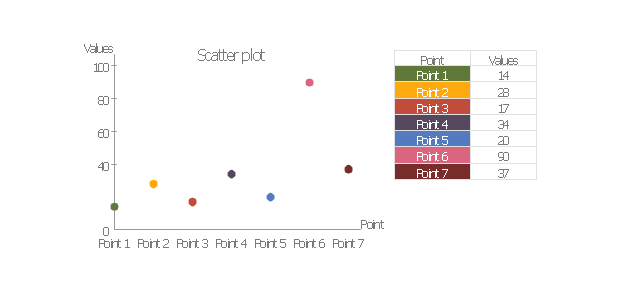
This sample shows the Scatter Plot without missing categories. It’s very important to no miss the data, because this can have the grave negative consequences. The data on the Scatter Chart are represented as points with two values of variables in the Cartesian coordinates. This sample can be used in the engineering, business, statistics, analytics, at the creating the financial and other types of reports.Scatter Graph Charting Software
ConceptDraw provides some interactive xy chart and scatter graph symbols that offers advanced features yet is simple to use.Basic Diagramming
Perfect charts and graphics diagramming software with rich examples and template. ConceptDraw is ideal to draw Charts and Graphics.
Scatter Plot
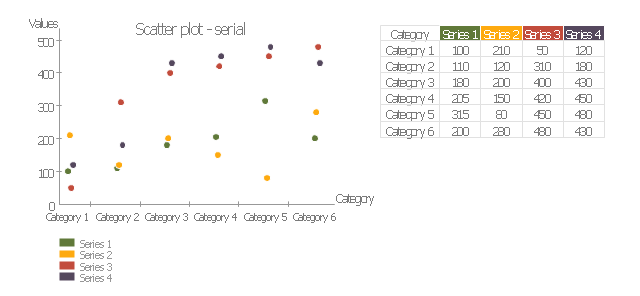
ConceptDraw PRO extended with Scatter Diagrams solution is ideal diagramming and vector drawing software for quick and easy designing professional looking Scatter Plot.Scatter Graph
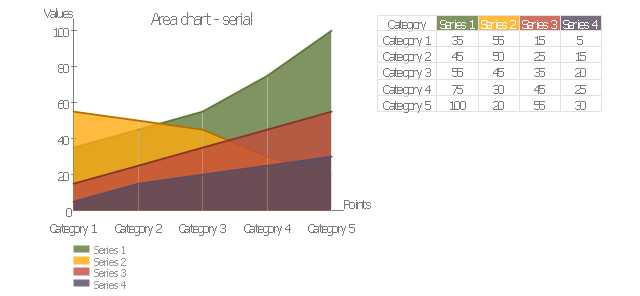
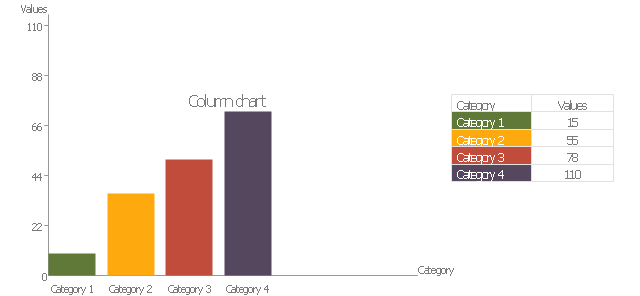
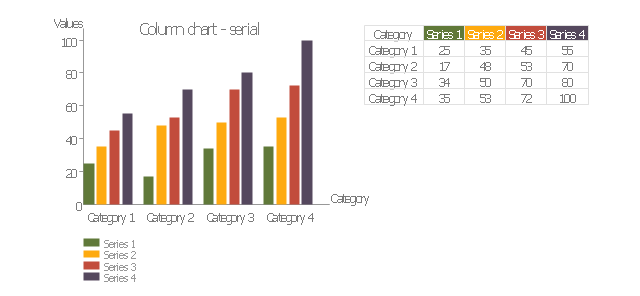
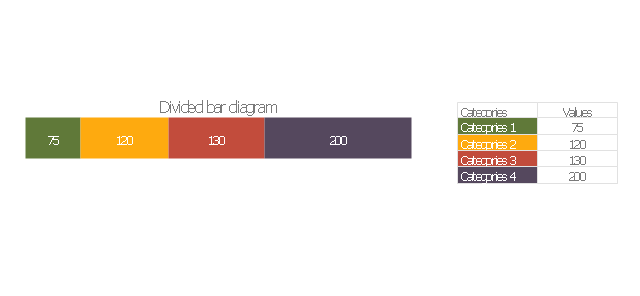
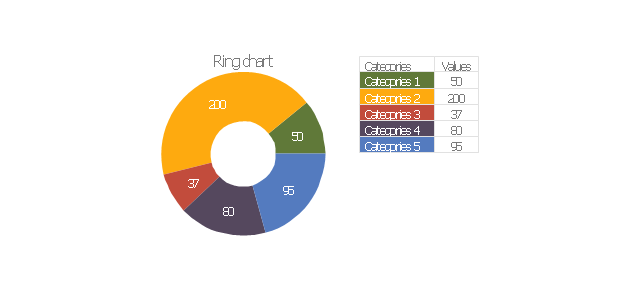
You've got to draw the Scatter Graph and look for the convenient tool which will help you? Direct your attention on the ConceptDraw PRO diagramming and vector drawing software extended with Scatter Diagrams Solution from the Graphs and Charts Area.The vector stencils library "Education charts" contains 12 graphs and charts: area chart, column chart, divided bar diagram, histogram, horizontal bar graph, line graph, pie chart, ring chart, scatter plot.
Use it to create your education infogram in the ConceptDraw PRO diagramming and vector drawing software.
The vector stencils library "Education charts" is included in the Education Infographics solution from the Business Infographics area of ConceptDraw Solution Park.
Use it to create your education infogram in the ConceptDraw PRO diagramming and vector drawing software.
The vector stencils library "Education charts" is included in the Education Infographics solution from the Business Infographics area of ConceptDraw Solution Park.
Line Chart Examples
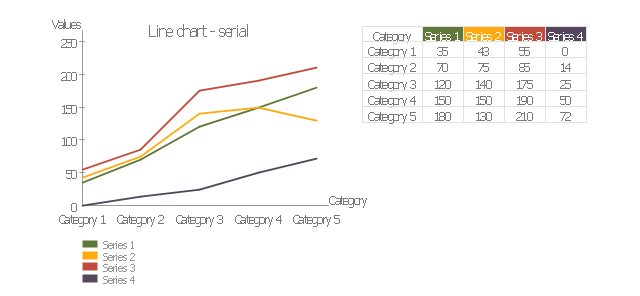
The Line Graphs solution from Graphs and Charts area of ConceptDraw Solution Park contains a set of examples, templates and design elements library of line and scatter charts. Use it to draw line and scatter graphs using ConceptDraw PRO diagramming and vector drawing software for illustrating your documents, presentations and websites.Pie Chart Word Template. Pie Chart Examples
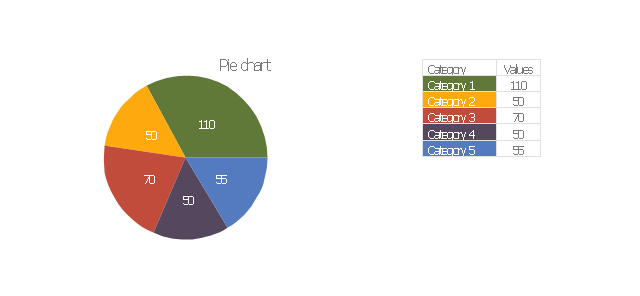
The Pie Chart visualizes the data as the proportional parts of a whole and looks like a disk divided into sectors. The pie chart is type of graph, pie chart looks as circle devided into sectors. Pie Charts are widely used in the business, statistics, analytics, mass media. It’s very effective way of displaying relative sizes of parts, the proportion of the whole thing.This example visual dashboard example shows website traffic metrics. Divided bar chart and pie chart are used to visualize compositional data. Scatter plot is used to visually analyse correlation between two data sets.
"Web traffic is the amount of data sent and received by visitors to a web site. ...
This is determined by the number of visitors and the number of pages they visit. Sites monitor the incoming and outgoing traffic to see which parts or pages of their site are popular and if there are any apparent trends, such as one specific page being viewed mostly by people in a particular country. There are many ways to monitor this traffic and the gathered data is used to help structure sites, highlight security problems or indicate a potential lack of bandwidth not all web traffic is welcome. Some companies offer advertising schemes that, in return for increased web traffic (visitors), pay for screen space on the site. Sites also often aim to increase their web traffic through inclusion on search engines and through search engine optimization." [Web traffic. Wikipedia]
The example "Website traffic dashboard" was created using the ConceptDraw PRO diagramming and vector drawing software extended with the Corellation Dashboard solution from the area "What is a Dashboard" of ConceptDraw Solution Park.
Chart Software for Better Presentations
Easy charting software comes with beautiful chart templates and examples. This makes it easy to create professional charts without prior experience. Graphs and Charts Area provide a wide collection of professional looking predesigned templates, samples and ready-to-use vector stencils that will help you to draw the charts and diagrams of various types: Pie Charts, Donut Charts, Line Charts, Column Charts, Bar Charts, Pyramids, Scatter Charts, Venn Diagrams, Spider Charts, Area Charts, Divided Bar Graphs.Rainfall Bar Chart
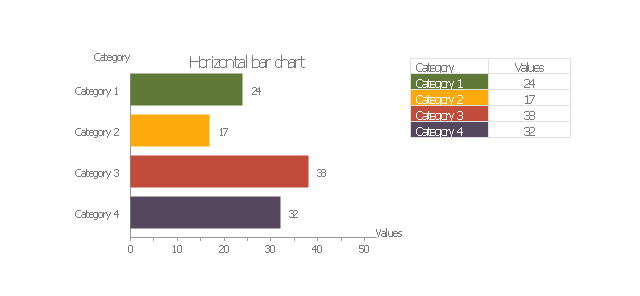
This sample shows the Horizontal Bar Chart of the average monthly rainfalls. This sample was created in ConceptDraw PRO diagramming and vector drawing software using the Bar Graphs Solution from the Graphs and Charts area of ConceptDraw Solution Park.Chart Examples
Easy charting software comes with beautiful chart templates and examples. This makes it easy to create professional charts without prior experience.- Scatter Chart Examples | Blank Scatter Plot | Percentage Pie Chart ...
- Blank Scatter Plot | Donut Chart Templates | Pie Chart Examples ...
- Spider Chart Template | Blank Scatter Plot | Pie Chart Examples and ...
- Venn Diagram Maker | Pie Donut Chart . Pie Chart Examples ...
- Bar Graphs | Blank Scatter Plot | Seating Plans | Diagram And Pie ...
- Pie Charts | Organizational Chart Templates | Blank Scatter Plot ...
- Donut Chart Templates | Pie Chart Examples and Templates ...
- Some Pie Chart Based On Tax On Education Field
- Blank Scatter Plot | How to Draw a Pictorial Chart in ConceptDraw ...
- Data-driven charts - Vector stencils library | Pie Chart Software ...
- Percentage Spider Chart | Blank Scatter Plot | Pie Chart For ...
- Create Graphs and Charts | Pie Chart Software | Scatter Graph ...
- Pie Chart Software | Create Graphs and Charts | Scatter Graph ...
- How to Create a Scatter Chart | Pie Charts | Chart Templates | Make ...
- Basic Diagramming | Line Graph | Bar Graph | Scatter Plot On Us ...
- Scatter Chart Examples | Scatter Chart Analysis. Scatter Chart ...
- Scatter Chart Examples | Blank Scatter Plot | Pyramid diagrams ...
- Scatter Chart Examples | Pyramid Diagram and Pyramid Chart ...
- Scatter Chart Examples | Bar Chart Software | The Best Flowchart ...
- Scatter Chart Examples | Scatter Graph Charting Software | How to ...


