Clipart School
Use it to make professional looking documents, presentations, and websites illustrated with color scalable vector clipart for geography, weather, and animals.Nature Clipart and Illustrations
ConceptDraw DIAGRAM is a vector design software, it includes numerous vector stencils. Weather vector clipart library for ConceptDraw DIAGRAM allows the user to produce professional-looking illustrations in seconds.Winter Sports Vector Clipart. Medal Map. Spatial Infographics
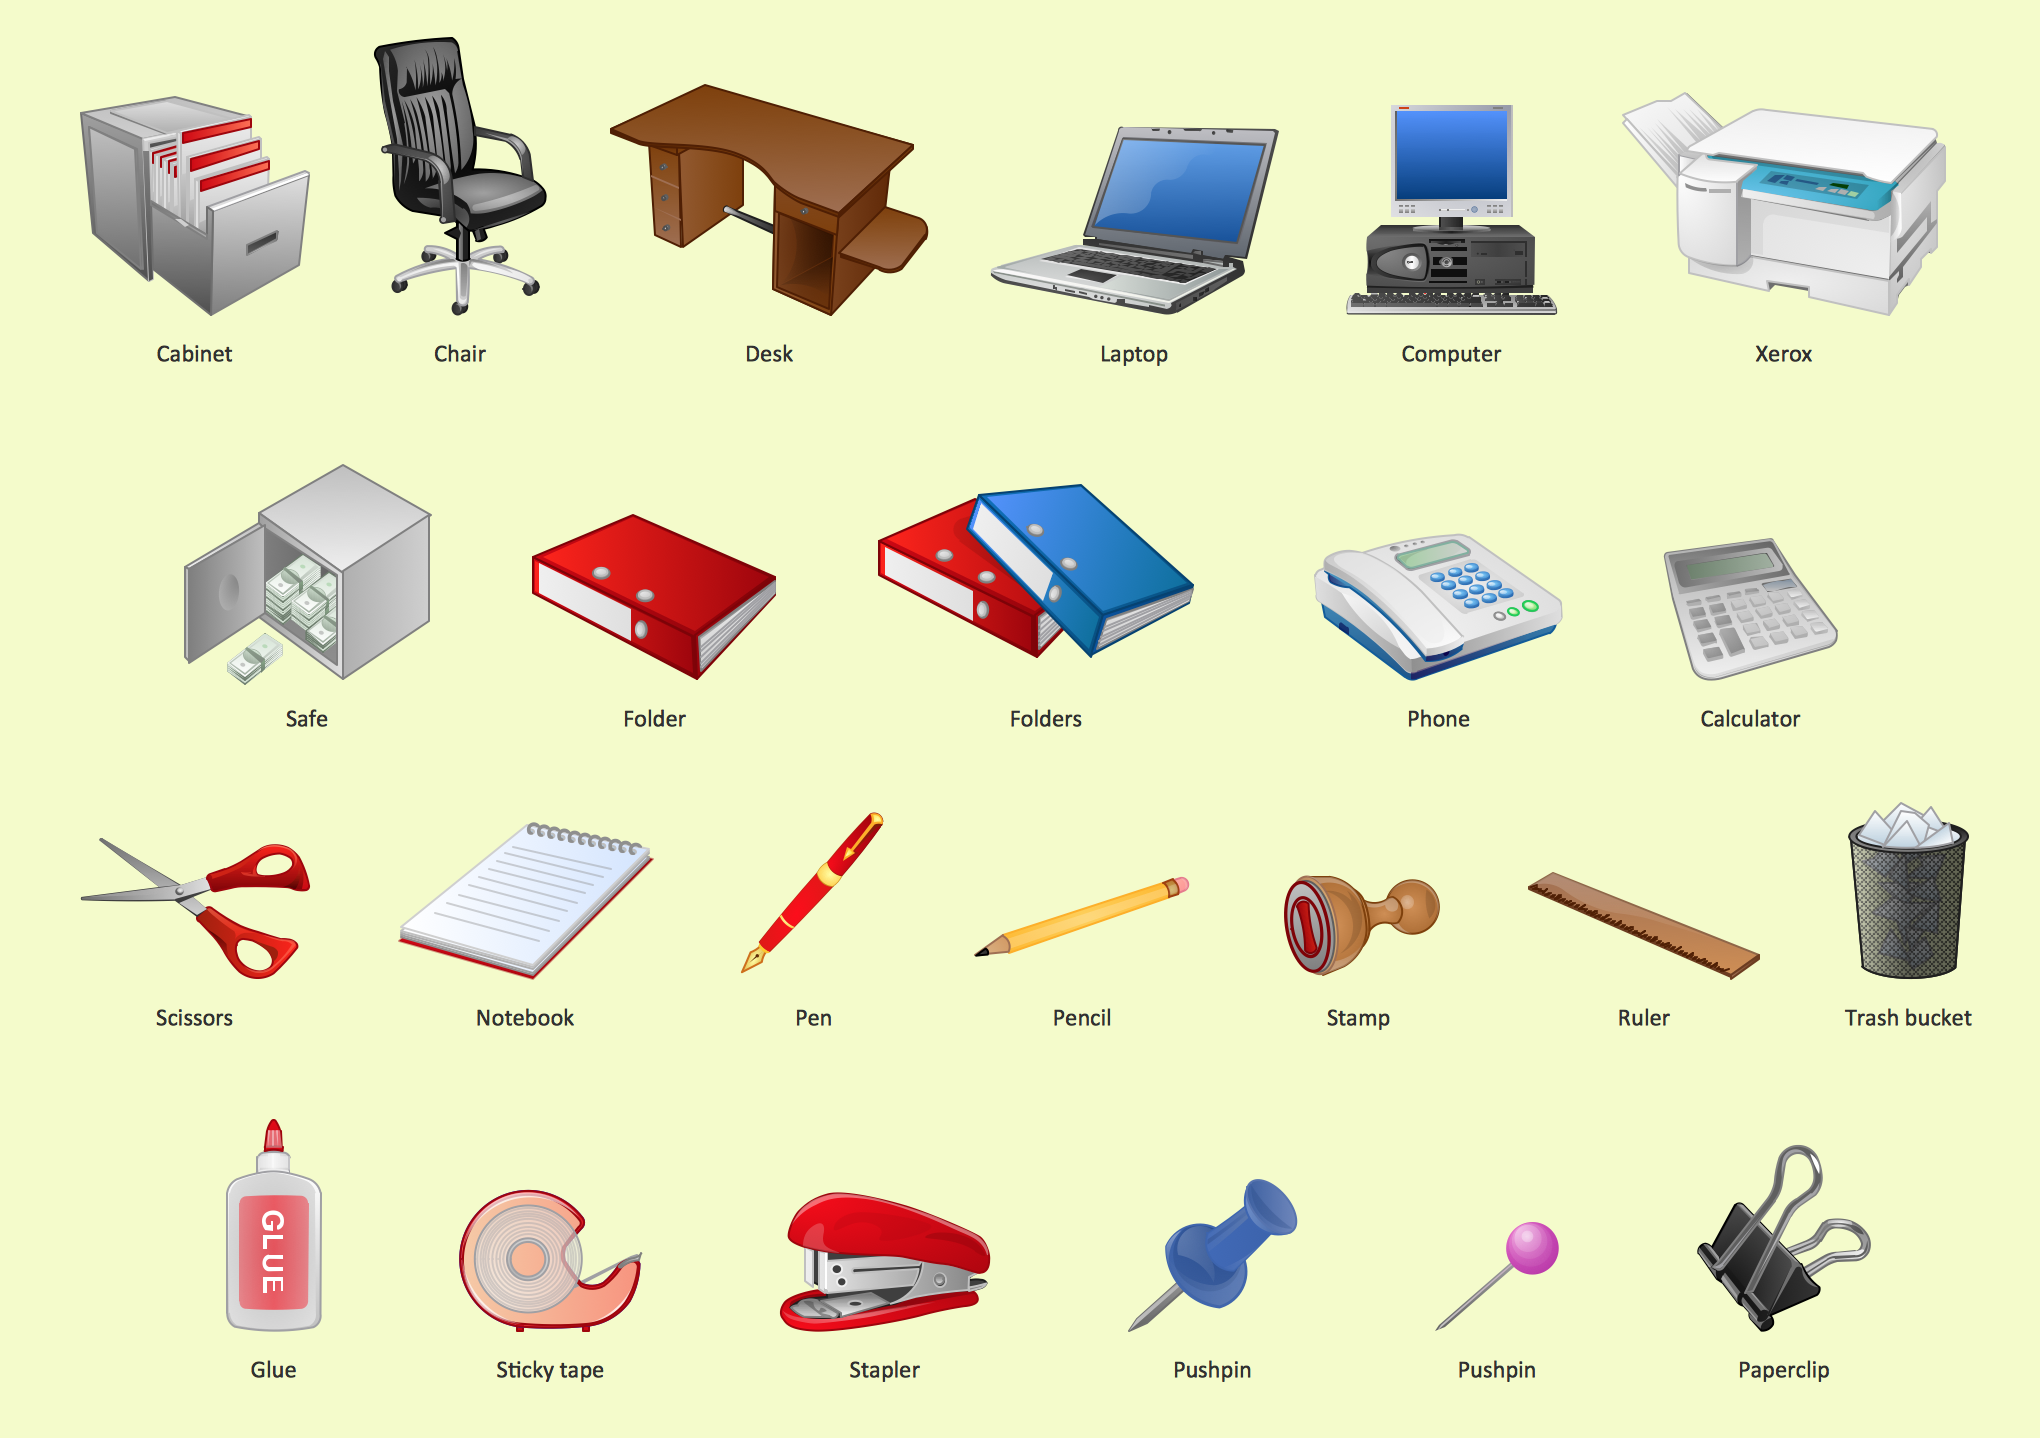
Tracking Olympic results in visual format is the most modern way to deliver statistics to a broad audience. This is a good example of an illustrated table you may easily modify, print, or publish on web from ConceptDraw Winter Sports solution.Office - Design Elements
Designing a workspace or office involves careful consideration of form and function. Conceptdraw offers you all nessesary office design elements in one library. Combine, match, design and create!Business and Finance Illustrations
Choose the business illustration design you love best, and sign our design your own style with Business and Finance Illustrations library from ConceptDraw DIAGRAM. The Business and Finance solution contains 12 vector clipart libraries: Advertising, Business, Business people clipart, Business people figures, Currency, Mail and post, Management, Marketing, Money, Office, Project management, Time
 Holiday
The Holiday Solution from Illustration area of ConceptDraw Solution Park contains holiday illustration examples, templates and vector clipart library.
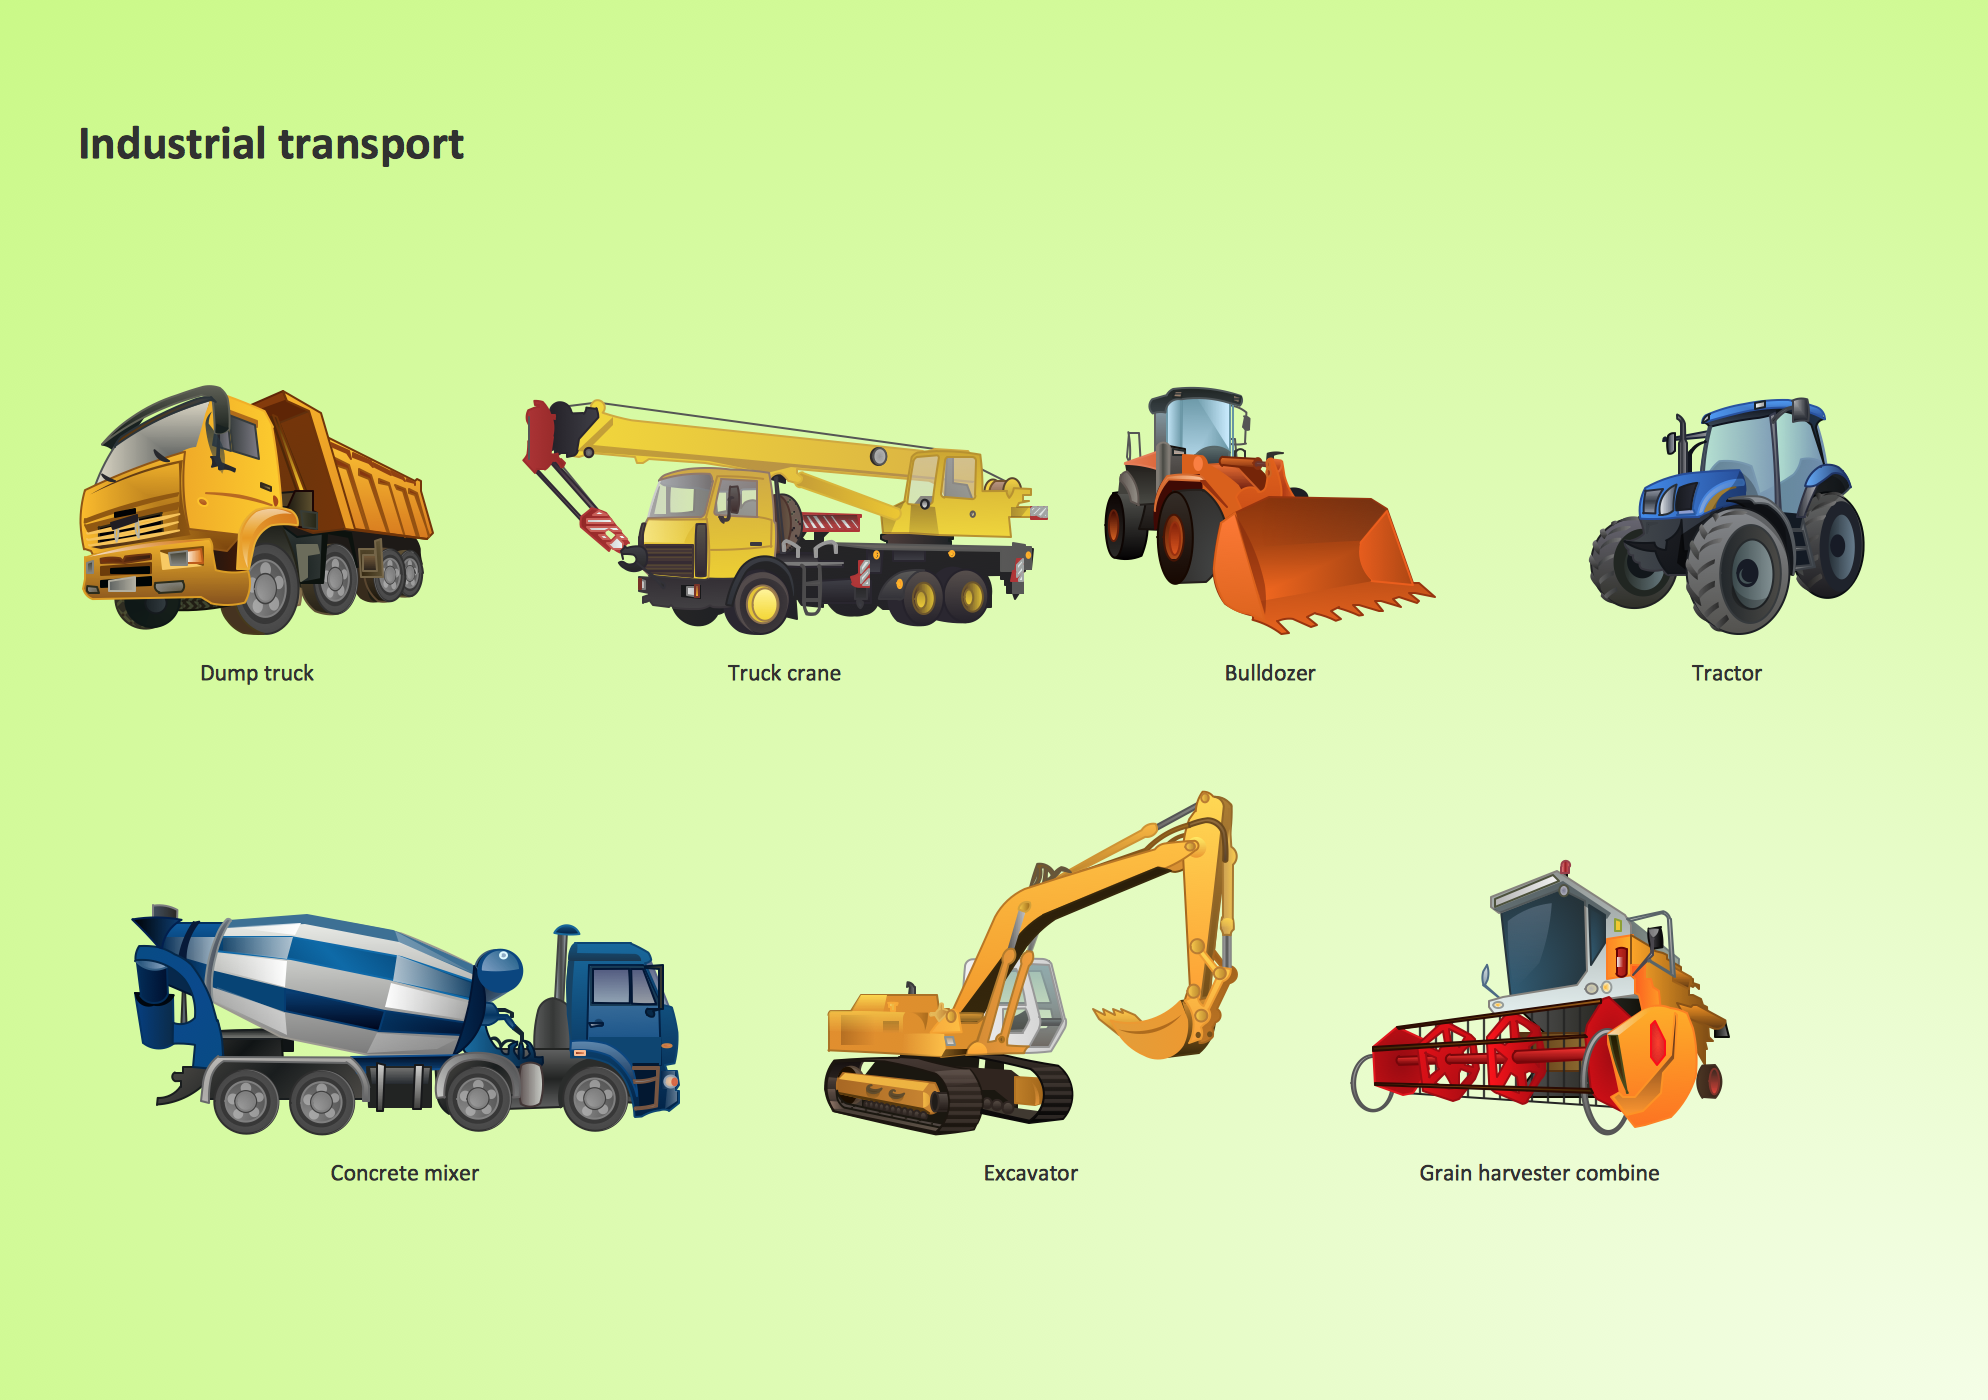
Industrial transport - Design elements
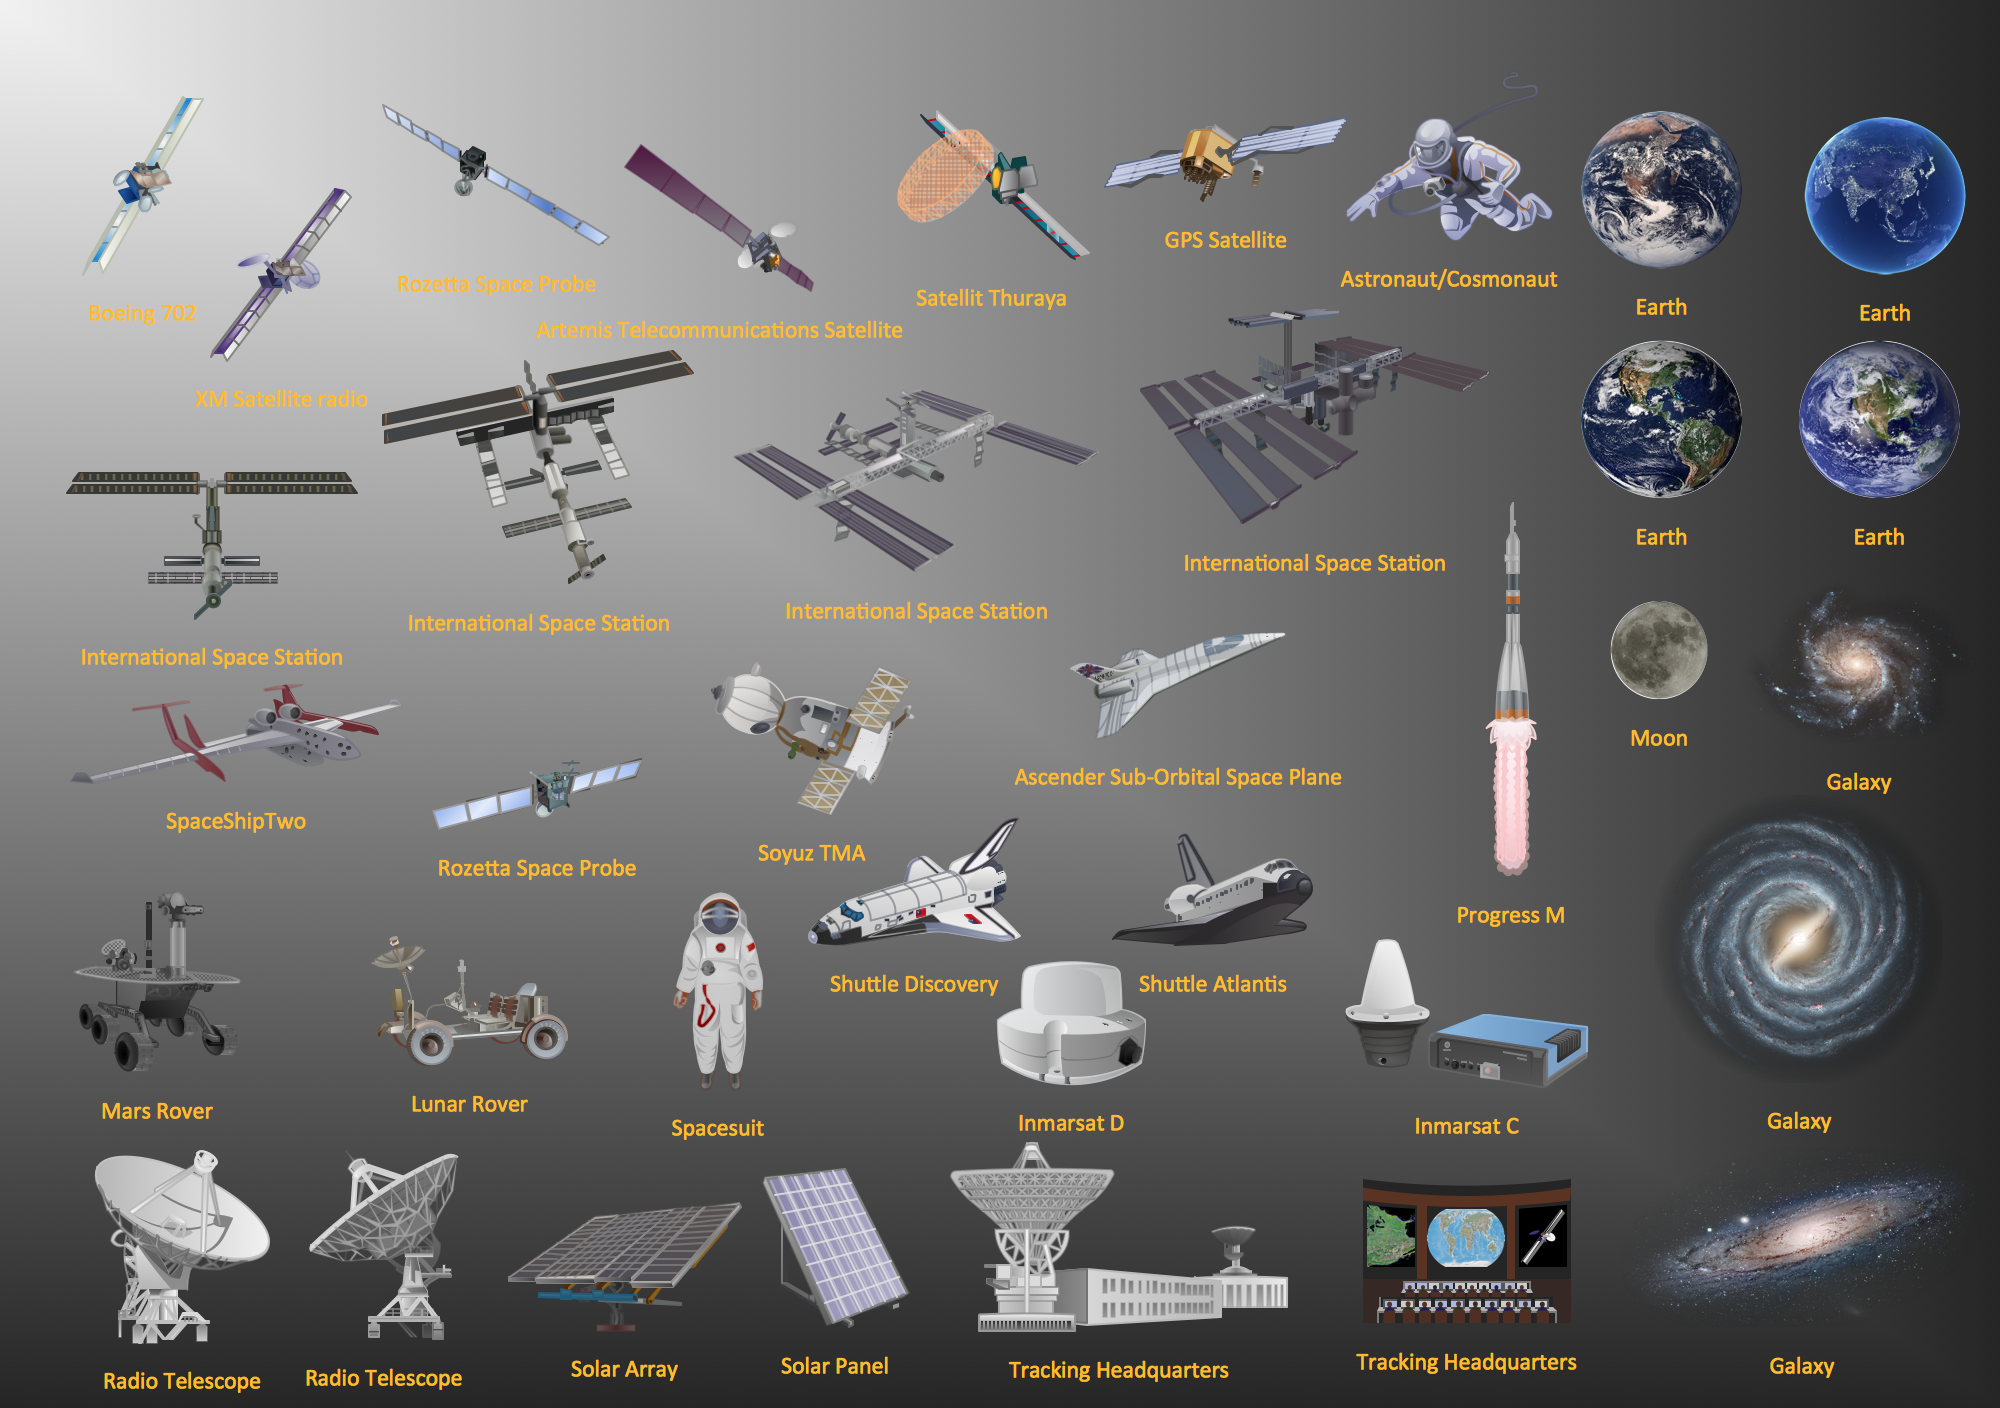
The vector stencils library Industrial transport contains clipart of industrial vehicles for ConceptDraw DIAGRAM diagramming and vector drawing software. Use it to draw illustrations of industrial vehicles, transportation, lifting and moving materials using machines.Aerospace - Design Elements
Samples, templates and libraries contain vector clip art for drawing the Aerospace Illustrations.The vector clipart library "Presentation design elements" contains 45 presentation symbols and arrows which you can easy use in your slides and illustrations.
"A presentation is the process of presenting a topic to an audience. It is typically a demonstration, lecture, or speech meant to inform, persuade, or build good will. ... the use of visuals reduced meeting times... audiences believe presenters who use visuals are more professional and credible than presenters who merely speak. ... meetings and presentations reinforced with visuals help participants reach decisions and consensus more quickly." [Presentation. Wikipedia]
The clip art example "Presentation design elements - Vector clipart library" was created in the ConceptDraw PRO diagramming and vector drawing software using the Presentation Clipart solution from the Illustration area of ConceptDraw Solution Park.
Design Pictorial Infographics. Design Infographics
In the course of recent decades data visualization went through significant development and has become an indispensable tool of journalism, business intelligence and science. The way visual information may be conveyed is not limited simply to static or dynamic representation, it can also be interactive. Infographics can be conditionally divided into several general levels. Primarily, this is level of visualization of information, its interpretation and association on any ground. Second level can be defined as a visualization of knowledge, depiction of thoughts and ideas in the form of images or diagrams. Finally, the level of data visualization, which processes data arrays in charts, enabling the information to be more clearly perceived. You can also identify the main approaches to the creation of infographics: exploratory and narrative. Exploratory method insists on minimalist design in favor of data precision without unnecessary details and is common for scientific researches and ana- Business and Finance | Management Area | Presentation Clipart ...
- Food Court Clipart In School
- Business People Clipart | Business and Finance Illustrations ...
- Clipart School | CCTV Network Example | Design elements ...
- Clipart School | Business People Clipart | Business - Design ...
- Business and Finance | Presentation Clipart | Holiday | Business ...
- Funny transport - Vector illustration | Illustration | Clipart School ...
- Business People Clipart | Watercraft - Design Elements | Clipart ...
- CCTV Network Example | Clipart School | CCTV Surveillance ...
