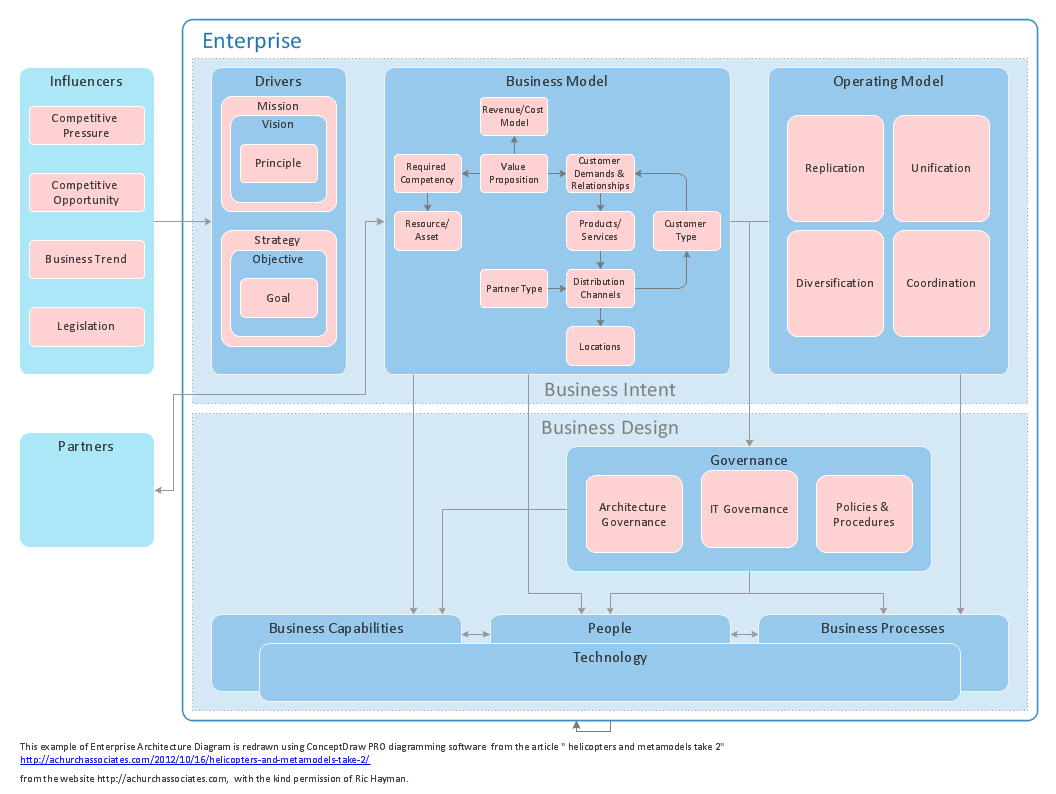
Venn Diagram Examples for Problem Solving
Venn diagrams are illustrations used in the branch of mathematics known as set theory. They show the mathematical or logical relationship between different groups of things (sets). A Venn diagram shows all the possible logical relations between the sets.ConceptDraw Arrows10 Technology
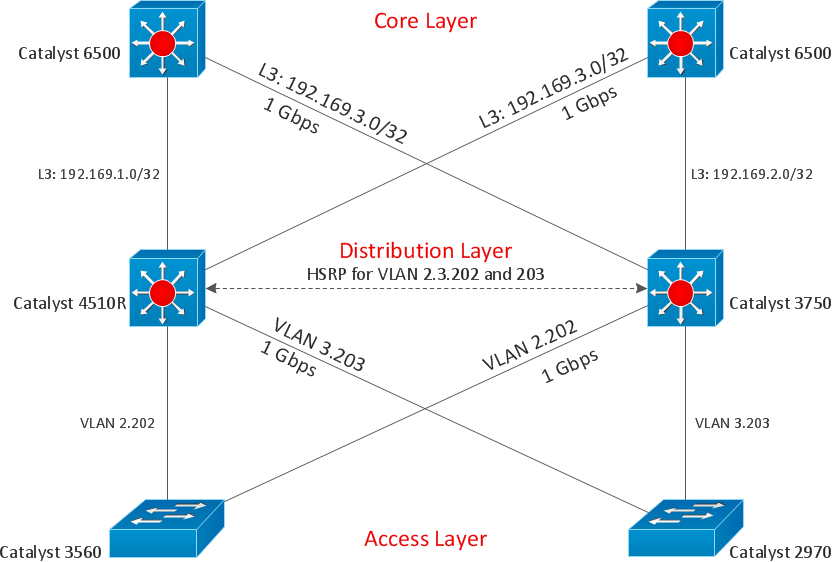
Connecting objects manually in ConceptDraw DIAGRAM is a snap: - points; - Connecting groups of objects; - Auto-routing; - Connectors text; - Snap to Guides ; - Quick.Create Block Diagram
Block diagrams solution extends ConceptDraw DIAGRAM software with templates, samples and libraries of vector stencils for creating the block diagram. Create block diagrams, electrical circuit diagrams, schematics, and more in minutes with ConceptDraw DIAGRAM.MS Visio Look a Like Diagrams
No need for any special drawing skills to create professional looking diagrams outside of your knowledge base. ConceptDraw DIAGRAM takes care of the technical details, allowing you to focus on your job, not the drawing. ConceptDraw DIAGRAM delivers full-functioned alternative to MS Visio. ConceptDraw DIAGRAM supports import of Visio files. ConceptDraw DIAGRAM supports flowcharting, swimlane, orgchart, project chart, mind map, decision tree, cause and effect, charts and graphs, and many other diagram types.How To Create Professional Diagrams
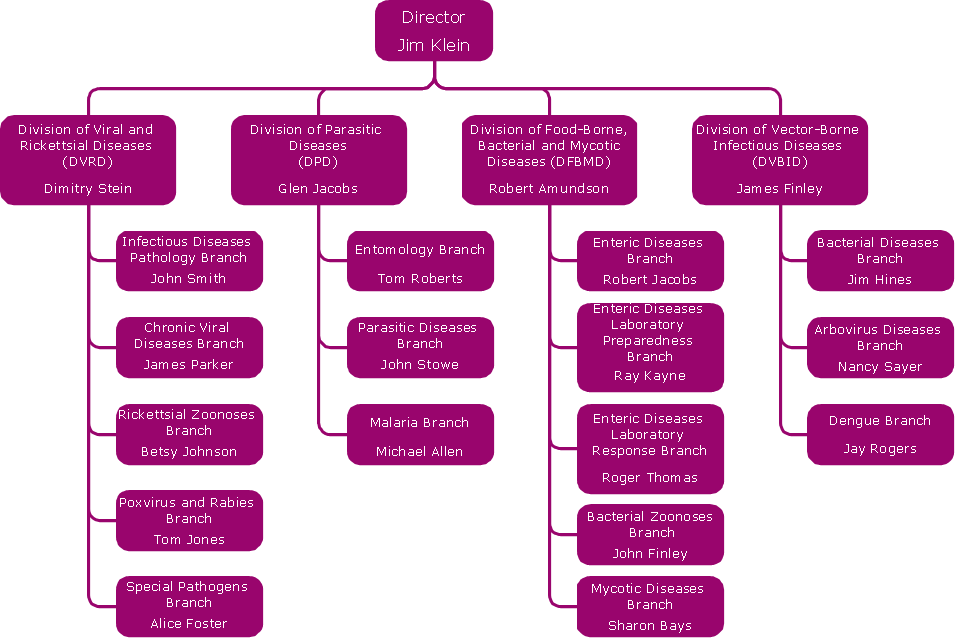
No need for any special drawing skills to create professional looking diagrams outside of your knowledge base. ConceptDraw DIAGRAM takes care of the technical side. Use templates, samples and special libraries for your needs.Powerful Drawing Feature for Creating Professional Diagrams
This will let you create professional diagrams and charts using its simple RapidDraw option just in clicks. Take a look on a diagram you are looking for and create it fast and quickly.Draw Diagram on Mac
Professional diagramming software for mac helps you create Cause and Effect diagram known as Fishbone diagram or Ishikawa diagram from ConceptDraw Business Solution. You will be offered to use templates, samples or draw your diagram using ConceptDraw Arrows10 TechnologyCross-Functional Flowchart (Swim Lanes)
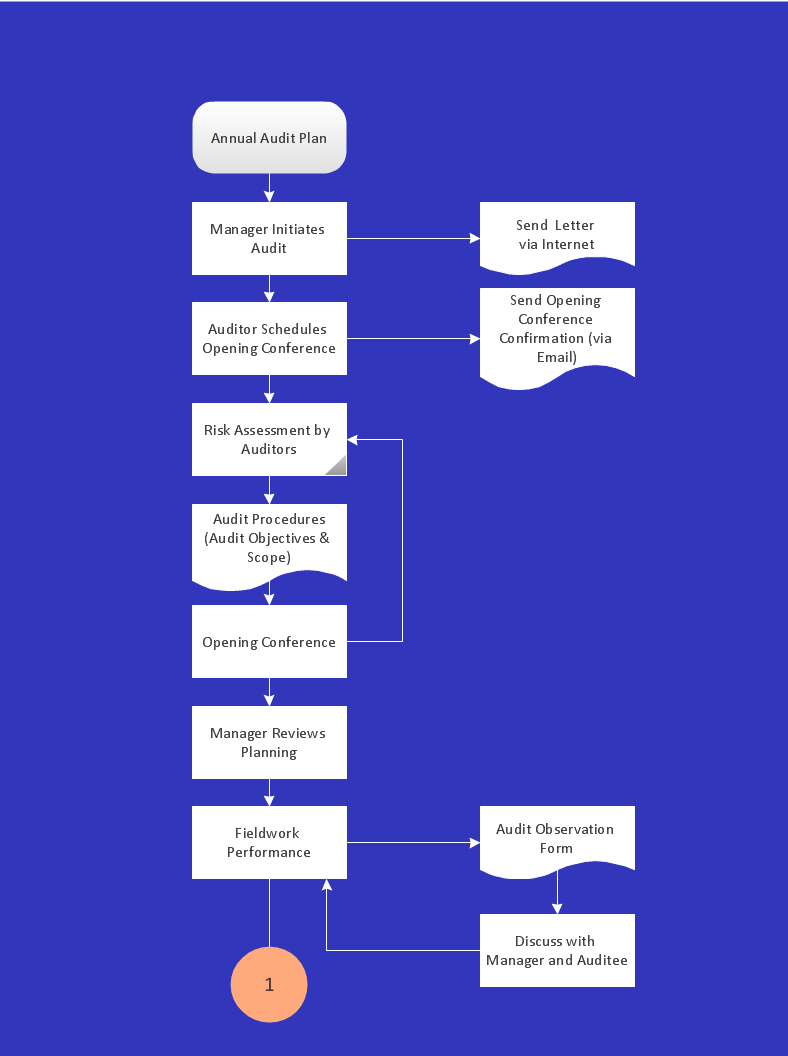
Cross-Functional Flowchart is a type of chart which shows the series of process steps connected by the arrows to depict their order and applies the swim lanes to provide an extra dimension with means of assigning each process step to certain category. Often the category or the functional unit is a stakeholder (department, person, role), resource, project, phase, or any other attribute. Cross-Functional Flowcharts visually illustrate relationships between the business processes and the functional units responsible for this processes. ConceptDraw DIAGRAM is a powerful diagramming and vector drawing software for professional design Cross-Functional Flowcharts using the common notation of shapes and swim lanes. Cross-Functional Flowcharts solution included to the Business Processes area of ConceptDraw Solution Park provides numerous well-designed vector objects and connector tools for quick, easy and effective organizing information, representing process flows and relationships, and drawing Cross-Functional Flowcharts for business, science, education, technology, etc.Create Sophisticated Professional Diagrams - Simply
ConceptDraw DIAGRAM is a powerful software that helps you create professional and easy drawing diagrams for business, technology, science and education.Cross Functional Flowchart for Business Process Mapping
Start your business process mapping with conceptDraw DIAGRAM and its Arrows10 Technology. Creating a process map, also called a flowchart, is a major component of Six Sigma process management and improvement. Use Cross-Functional Flowchart drawing software for business process mapping (BPM). Use a variety of drawing tools, smart connectors and shape libraries to create flowcharts of complex processes, procedures and information exchange. Define and document basic work and data flows, financial, production and quality management processes to increase efficiency of you business.How To Create a Bubble Chart
Bubble diagrams solution extends ConceptDraw DIAGRAM software with templates, Using ConceptDraw Connectors, you can create a bubble chart in moments. Using ConceptDraw you will be able to create a bubble chart from the ready ConceptDraw library objects or make your own objects. The created diagram can represent ideas organization, in brainstorming processes, by teachers for explaining difficult ideas or for presentations.How To Make a Bubble Chart
Bubble diagrams solution extends ConceptDraw DIAGRAM software with templates, Using ConceptDraw Connectors, you can make a bubble chart in moments. Using ConceptDraw you will be able to make a bubble chart from the ready ConceptDraw library objects or make your own objects. The created diagram can represent ideas organization, in brainstorming processes, by teachers for explaining difficult ideas or for presentations.Create Professional Looking Diagrams
No need for any special drawing skills to create professional looking diagrams outside of your knowledge base. ConceptDraw DIAGRAM takes care of the technical details, allowing you to focus on your job, not the drawing.How To Draw a Diagram
Is it possible to draw a diagram as quickly as the ideas come to you? The innovative ConceptDraw Arrows10 Technology included in ConceptDraw DIAGRAM is a simple and powerful tool to create any type of diagram. You mau choose to start from one of plenty diagram templates or to use your own idea.Design Diagrams the Fast and Easy Way
It is so simple making the drawing process easier and faster. you just need to choose the right drawing software. ConceptDraw Arrows10 Technology - This is so easy and fast to draw any type of diagram with any degree of complexity.- Sample Diagrams In Science Project
- Process Flowchart | Venn Diagram Examples for Problem Solving ...
- Venn Diagram Examples for Problem Solving. Computer Science ...
- Basic Flowchart Symbols and Meaning | Business Diagram Software ...
- Product Examples Science
- Rolla USGS Center locator map | Baseball | Pyramid Diagram ...
- Technology Tool With Diagrams
- Create Science Diagrams Mac
- Educational Technology Tools | Information Technology Architecture ...
- Educational Technology Tools | Educational Materials | Biology ...
- Create Block Diagram | ConceptDraw Arrows10 Technology | Cross ...
- Basic Flowchart Symbols and Meaning | Venn Diagram Examples ...
- Physics | Physics Diagrams | ConceptDraw Arrows10 Technology ...
- Education Information | Biology Illustration | Educational Technology ...
- MindTweet | Venn Diagram Examples for Problem Solving ...
- Venn Diagram Examples for Problem Solving . Quantum Information ...
- Swim Lane Diagrams | Cross-Functional Flowchart (Swim Lanes ...
- Venn Diagram Examples for Problem Solving. Computer Science ...
- Use Case Diagrams technology with ConceptDraw PRO | Cross ...
- Basic Flowchart Symbols and Meaning | Pyramid Diagram ...


.png)

