This site uses cookies. By continuing to browse the ConceptDraw site you are agreeing to our Use of Site Cookies.

Scientific Symbols Chart

ConceptDraw DIAGRAM is the beautiful design software that provides many vector stencils, examples and templates for drawing different types of illustrations and diagrams.

Mathematics Solution from the Science and Education area of ConceptDraw Solution Park includes a few shape libraries of plane, solid geometric figures, trigonometrical functions and greek letters to help you create different professional looking mathematic illustrations for science and education.

Biology Illustration

Biology solution offers 3 libraries of ready-to-use predesigned biology symbols and vector clipart to make your biology drawing and biology illustration making fast and easy: Carbohydrate Metabolism Library, Biochemistry of Metabolism Library, Citric Acid Cycle (TCA Cycle) Library.

Chemistry Drawings

ConceptDraw DIAGRAM diagramming and vector drawing software extended with Chemistry solution from the Science and Education area is a powerful chemistry drawing software that is ideal for quick and easy designing of various: chemistry drawings, scientific and educational chemistry illustrations, schemes and diagrams of chemical and biological lab set-ups, images with chemical formulas, molecular structures, chemical reaction schemes, schemes of labware, that can be then successfully used in the field of science and education, on various conferences, and so on.

Illustration Software

No science can't exist without illustrations, and especially astronomy! Illustrations help to visualize knowledge, natural phenomenons which are studied by astronomy, they equally effective help in work, during the learning process and on the conferences. Now we have professional astronomy illustration software - ConceptDraw DIAGRAM illustration and sketching software with templates, samples and libraries of a variety of astronomy symbols, including constellations, galaxies, stars, and planet vector shapes; a whole host of celestial bodies. When drawing scientific and educational astronomy illustrations, astronomy pictures and diagrams, can help you reach for the stars!

Astronomy Symbols

Are you an astronomer, astronomy teacher or student? And you need to draw astronomy pictures quick and easy? ConceptDraw DIAGRAM diagramming and vector drawing software extended with Astronomy solution from the Science and Education area will help you! Astronomy solution provides 7 libraries with wide variety of predesigned vector objects of astronomy symbols, celestial bodies, solar system symbols, constellations, etc.

Cylinder Venn Diagram

You need design Cylinder Venn Diagram? Nothing could be easier with ConceptDraw DIAGRAM vector diagramming and drawing software extended with Business Diagrams Solution from the Management Area. ConceptDraw DIAGRAM allows you to design various Venn Diagrams including Cylinder Venn Diagrams.

Chemistry Symbols and Meanings

Chemistry solution offers 5 libraries with large collection of vector chemistry symbols and meanings, chemistry equation symbols, organic chemistry symbols, and chemical clipart: Chemical Elements Library, Chemical Drawings Library, Conformations Library, Laboratory Equipment Library, Periodic Table of Chemical Elements Library.

Cross-Functional Flowchart (Swim Lanes)

Cross-Functional Flowchart is a type of chart which shows the series of process steps connected by the arrows to depict their order and applies the swim lanes to provide an extra dimension with means of assigning each process step to certain category. Often the category or the functional unit is a stakeholder (department, person, role), resource, project, phase, or any other attribute. Cross-Functional Flowcharts visually illustrate relationships between the business processes and the functional units responsible for this processes. ConceptDraw DIAGRAM is a powerful diagramming and vector drawing software for professional design Cross-Functional Flowcharts using the common notation of shapes and swim lanes. Cross-Functional Flowcharts solution included to the Business Processes area of ConceptDraw Solution Park provides numerous well-designed vector objects and connector tools for quick, easy and effective organizing information, representing process flows and relationships, and drawing Cross-Functional Flowcharts for business, science, education, technology, etc.

Bar Diagrams for Problem Solving. Create space science bar charts with Bar Graphs Solution

Bar charts represent data in different categories or groups. Create bar graphs for visual solving your scientific problems and data comparison using the ConceptDraw DIAGRAM diagramming and vector drawing software extended with the Bar Graphs Solution from the Graphs and Charts area of ConceptDraw Solition Park.

Flowchart Maker

A flowchart maker is a software showing the interaction, sequence or organization. It also known as flowchart maker or ConceptDraw DIAGRAM standard supplied with different types of symbol collections: standard symbols, branded set and authored. It used strictly for enhancing scientific or business documents with abstract explanatory pictures. Business graphic applications show a special knowledge representations and include many features for creating schematic pictures. These graphic tools are known as flowchart maker or flowchart maker software.
This circle diagram sample was redesigned from the Wikimedia Commons file: Research cycle.png. "Some of the basic elements of the scientific method, arranged in a cycle to emphasize that it is an iterative process." [commons.wikimedia.org/ wiki/ File:Research_ cycle.png]
This file is licensed under the Creative Commons Attribution 2.0 Generic license. [creativecommons.org/ licenses/ by/ 2.0/ deed.en]
"The scientific method is a body of techniques for investigating phenomena, acquiring new knowledge, or correcting and integrating previous knowledge. To be termed scientific, a method of inquiry must be based on empirical and measurable evidence subject to specific principles of reasoning. ...
Four essential elements of the scientific method are iterations, recursions, interleavings, or orderings of the following:
(1) Characterizations (observations, definitions, and measurements of the subject of inquiry).
(2) Hypotheses (theoretical, hypothetical explanations of observations and measurements of the subject).
(3) Predictions (reasoning including logical deduction from the hypothesis or theory).
(4) Experiments (tests of all of the above)...
A linearized, pragmatic scheme of the four points above is sometimes offered as a guideline for proceeding:
(1) Define a question.
(2) Gather information and resources (observe).
(3) Form an explanatory hypothesis.
(4) Test the hypothesis by performing an experiment and collecting data in a reproducible manner.
(5) Analyze the data.
(6) Interpret the data and draw conclusions that serve as a starting point for new hypothesis.
(7) Publish results.
(8) Retest (frequently done by other scientists).
The iterative cycle inherent in this step-by-step method goes from point 3 to 6 back to 3 again." [Scientific method. Wikipedia]
The circle diagram example "Research cycle" was created using the ConceptDraw PRO diagramming and vector drawing software extended with the Target and Circular Diagrams solution from the Marketing area of ConceptDraw Solution Park.
www.conceptdraw.com/ solution-park/ marketing-target-and-circular-diagrams
Circle diagram
Circle diagram, circle diagram, circular diagram,

How to do presentation of Mind Maps via Skype conference call?

ConceptDraw MINDMAP is powerful and multifunctional mind mapping software with wide variety of relevant features, which make it comfortable for brainstorming, generating ideas, creating beautiful and professional-looking Mind Maps. ConceptDraw MINDMAP provides wide importing and exporting capabilities to variety of formats, among them MS PowerPoint, MS Word, MS Excel, FreeMind, XMind, MindJet Mindmanager, HTML, PDF, graphical formats. An innovative Skype conference call feature deserves the special attention of users, it is useful for teams, it lets to hold the presentations of Mind Maps via Skype and to collaborate in active Skype call. But how to do the presentation of Mind Map via Skype conference call by means of ConceptDraw MINDMAP software? Simply make the Skype conference call, share the presentation via Skype for active call participants using the Remote Presentation for Skype solution, keep the presentation file synchronized between all participants of Skype call. ConceptDraw MINDMAP lets also edit a Mind Map and to do slide show again with no interruption a call.

Chemistry Drawing Software

ConceptDraw DIAGRAM extended with Chemistry solution from the Science and Education area is a powerful chemistry drawing software that provides the useful tools to help you design all kinds of chemistry drawings and illustrations, chemical schemes and diagrams of formulas, reaction schemes and lab set-ups of any complexity.

Solar System Symbols

Astronomy solution provides the Stars and Planets library with wide variety of solar system symbols. You can find here vector objects of solar system, of stars and planets of the universe. To quickly draw any astronomy illustration: create new document and simply drag the needed solar system symbols from the Stars and Planets library, arrange them and add the text. You can also use the predesigned templates and samples from the ConceptDraw STORE as the base for your own sun solar system illustrations, astronomy and astrology drawings.

Examples of Flowcharts, Org Charts and More

ConceptDraw DIAGRAM covers a broad spectrum of business graphics categories and offers at ConceptDraw STORE enormous online collection of pictorial examples and samples for different thematics and application areas. It is a plentiful source of inspiration and wonderful examples of professionally designed diagrams, flowcharts, UML diagrams, organizational charts, databases, ERDs, network diagrams, business charts, different thematic charts, schematics, infographics and plans developed specially for knowledge workers, engineers, managers, businessmen, marketing specialists, analytics, scientists, students, professors, journalists and also for a large number of other people that every day use various diagrams and drawings in their work and life activity. Each of these examples is a real art, all they are well thought-out and designed without efforts with help of powerful tools of ConceptDraw DIAGRAM software. ConceptDraw examples display all variety of tasks, possibilities and results that ConceptDraw Product Line lets achieve fast and easy. ConceptDraw is one of the best Visio alternatives for Mac. It open all Visio formats like.vsdx,.vss,.vdx files and allows you to export files to Visio formats.
What is ConceptDraw OFFICE

How To Create a Bubble Chart

Bubble diagrams solution extends ConceptDraw DIAGRAM software with templates, Using ConceptDraw Connectors, you can create a bubble chart in moments. Using ConceptDraw you will be able to create a bubble chart from the ready ConceptDraw library objects or make your own objects. The created diagram can represent ideas organization, in brainstorming processes, by teachers for explaining difficult ideas or for presentations.

Chemistry Equation Symbols

If you are related with chemistry in you work or education activity, you need often draw various illustrations with chemistry equations. ConceptDraw DIAGRAM diagramming and vector drawing software offers you the Chemistry solution from the Science and Education area. Chemistry solution provides the Chemical Drawings Library with large quantity of vector chemistry equation symbols to help you create professional looking chemistry diagrams quick and easy.

sentence diagrammer, sentence diagrammer program, sentence diagram, free sentence diagrammer    Language Learning

sentence diagrammer, sentence diagrammer program, sentence diagram, free sentence diagrammer
Having the language learning experience and the decent tool for creating the language-related drawings are two keys to becoming a successful teacher. Good education becomes more and more important these days so making it possible to teach someone some language within a short period of time might make any teacher a successful and a popular one leading to more success and so the popularity. Using the ConceptDraw DIAGRAM charting and drawing software for making any needed scientific and educational illustrations seems to be the best choice to make.

Physics Diagrams

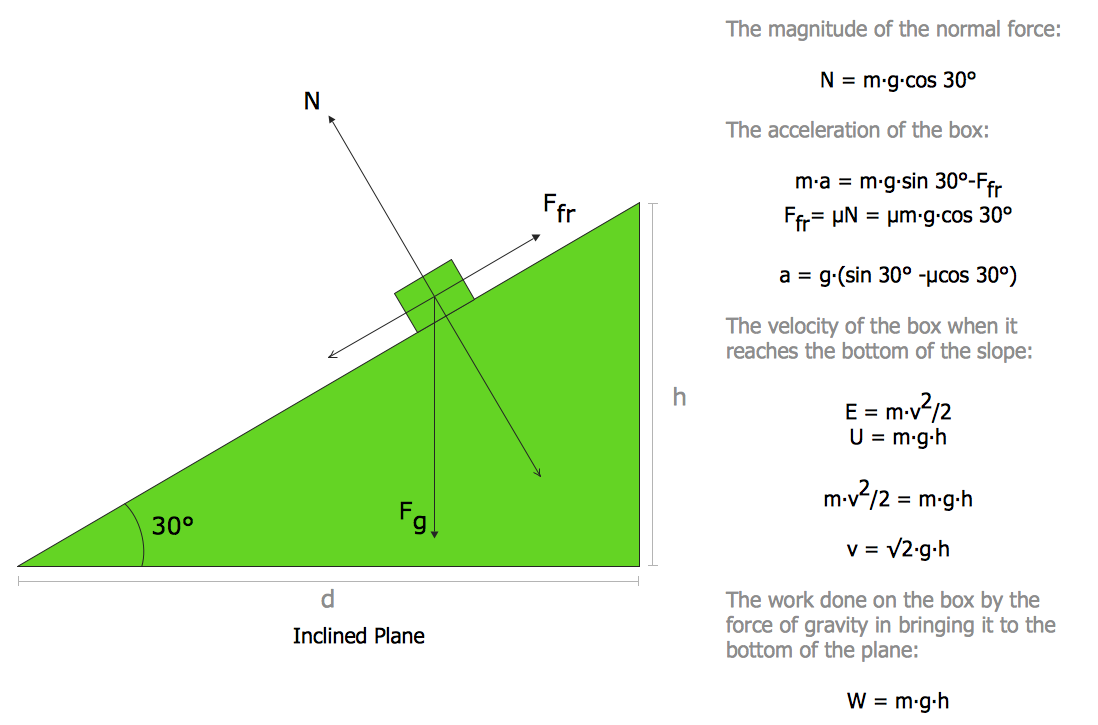
ConceptDraw DIAGRAM diagramming and vector drawing software extended with Physics solution from the Science and Education area is the best for creating: physics diagrams, pictures which describe various physical facts and experiments, illustrations of various electrical, mechanical and optic processes, of any complexity quick and easy.

Exam Preparation Mind Map

Mind Map is a way to effectively visualize the complex knowledge, to simplify and accelerate the learning and teaching processes. In this way Mind Maps are always in demand in a lot of spheres, among them business, education, engineering, software development, and many others. Mind Maps are perfect for illustration the documents, reports, textbooks, websites, education materials, lectures, etc. The ConceptDraw MINDMAP professional software from ConceptDraw Office suite provides a lot of powerful tools for brainstorming and designing colorful and attractive Mind Maps, drawings and charts, which ideally suit for structuring information and its representation in a visual and comprehensive form. To prepare effectively for examination, you need organize yourself and also clearly understand the correct sequence of actions. This Mind Map created in ConceptDraw MINDMAP application illustrates the main items during the exam preparation process. The use of predesigned cliparts lets to make your Mind Maps illustrative, colorful and attractive.