Pyramid Diagram
The Project Management Triangle Diagram depicts three main constraints of any project: scope, time and cost. Projects have to comply with the specified scope, projects should be finished in time and projects need to consume the budget. Each of the constraints represents one side of the triangle, and any change in budget or timing or scope affects the entire diagram. This diagram was made using ConceptDraw Office suite including best marketing project management software extended with collection of tools for creative project management software and project management reporting software symbols.Workflow Process Example
One of the most popular option helps to draw diagrams faster is pre-designed set of examples related to each kind of diagram. ConceptDraw PRO software extended with the Workflow Diagrams solution delivers a complete set of workflow process examples helps you to start making your own workflow faster.Pyramid Diagram
A Venn-diagram style chart of the "project triangle" showing visually the potential overlaps between speed, quality and low cost, along with the "inability" to accomplish all three.Process Flow Chart Symbols
Process Flow Chart is a visual diagram which shows the processes and relationships between the major components in a system, and uses for this the special process flow chart symbols: special shapes to represent different types of actions and process steps, lines and arrows to represent relationships and sequence of steps. It often named process flow diagram, it use colored flowchart symbols. It is incredibly convenient to use the ConceptDraw PRO software extended with Flowcharts Solution from the "Diagrams" Area of ConceptDraw Solution Park for designing professional looking Process Flow Charts.Project Management
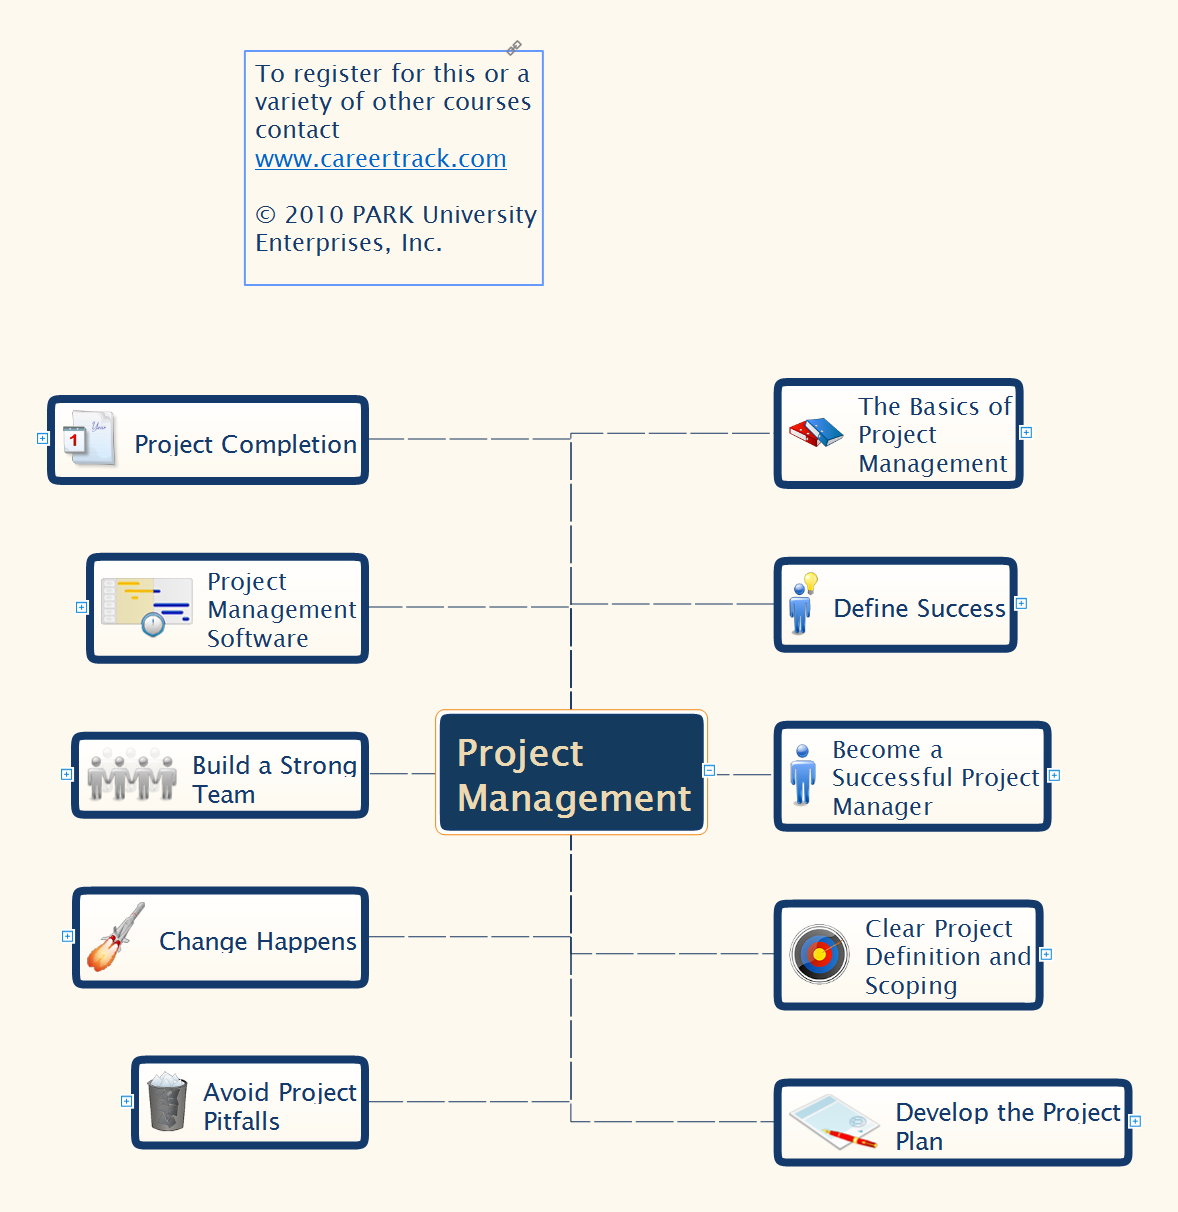
Mind Maps is a visual tool that helps to structure, understand and analyze the information, to find new ideas and solutions to problems. They find their application in many areas of life due to the fact that are convenient graphical way of presenting information. The project management is one of the most popular applications of Mind Maps, which give you the opportunity to make your project plan, to navigate easier in the project and manage it visually, to systematize knowledge, to get a clear picture of what is happening in the project, to save time and quickly find the right solutions and possible defects. Mind Maps ideally suit as a way to make notes during the meetings, presentations, conferences, to record ideas generated during a brainstorming. ConceptDraw MINDMAP software is effective for using in project management. It offers the tools for brainstorming and Mind Maps construction, helps project managers to visually represent the whole project, its implementation phases, to track the current state and switch between the different levels of detailing, showing or hiding some branches. ConcepDraw MINDMAP lets the possibility to make the report or presentation from your Mind Map and provides the compatibility with ConceptDraw Project and MS Project.Cause and Effect Fishbone Diagram
Cause and Effect Fishbone Diagram is one of the popular productivity and management tools widely used in business organizations. It is also known as Fishbone Diagram, because it looks like a fish skeleton. Cause and Effect Diagram provides a structured way which helps to identify all possible causes of a problem. Cause and Effect Diagram can be applied anywhere where exists a causal relationship. Now the problem of complexity the Cause and Effect Fishbone Diagram creating is solved thanks to the ConceptDraw PRO diagramming and vector drawing software extended with Fishbone Diagrams solution from the Management area.Network Diagram Software IVR Balance Recharge Diagram
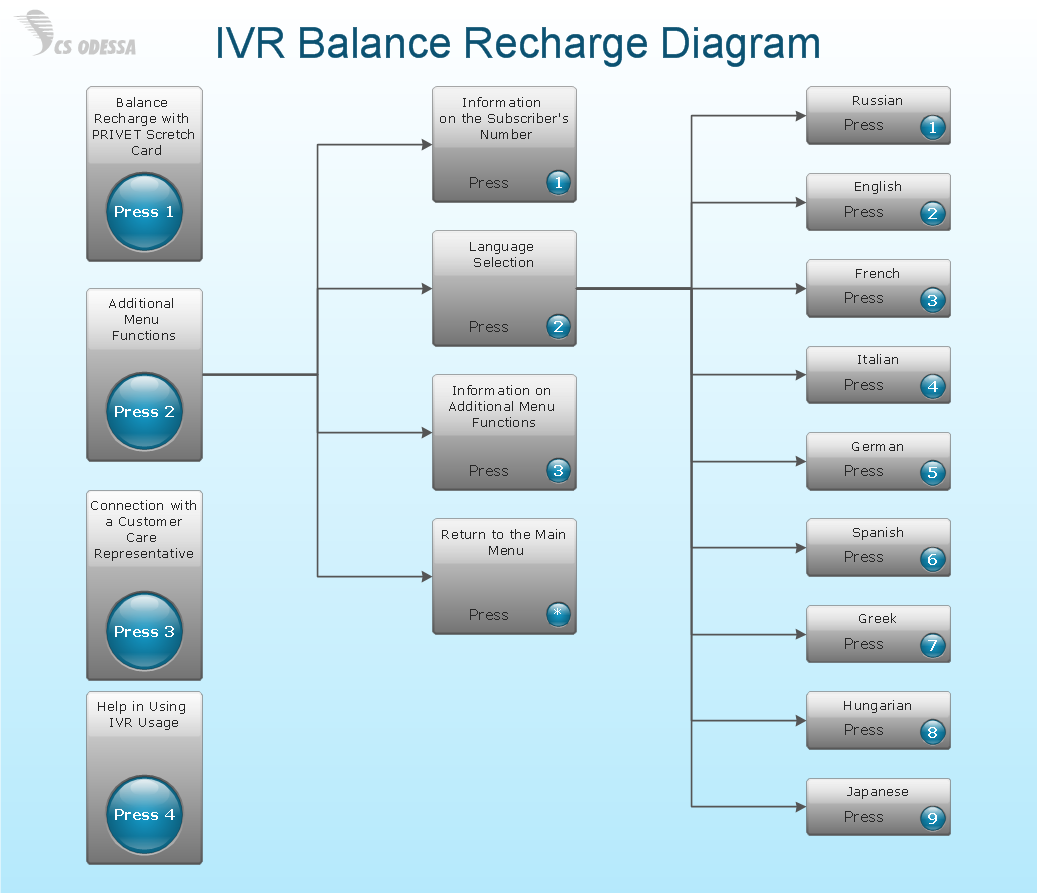
Interactive Voice Response (IVR) Balance Recharge Diagram
Pyramid Diagram
The Time-Money-Quality Triangle illustrates an advertising truism, that you can't have all three.How To Create Project Report
ConceptDraw PROJECT contains an extensive tool set to help project managers. The rich data visualization capability that is provided by ConceptDraw products helps you create project dashboards, one-click reports, multi-project views, Gantt charts, and resource views. Let′s learn how to get maximum value using ConceptDraw PROJECT!Why Flowchart Important to Accounting Information System?
The Accounting flowchart shows how information flows from source documents through the accounting records. The are based on the accounting procedures or processes. Flowcharts are used to represent accounting information in a system . There are special symbols which are used to create accounting flowcharts. Try conceptdraw flowcharting set of symbols to draw a professional charts.- Scope Of Management Chart Digram
- Flow Chart Of Scope Of Management
- Scope Of Export Marketing With Diagram
- Cross-Functional Flowchart Basics | Flow Chart For Scope
- Pyramid Diagram | Project management life cycle - Flowchart | How ...
- Project Management Venn Diagram
- Project — Working With Costs | Project management life cycle ...
- Pyramid Diagram | Workflow Process Example | Flowchart design ...
- Target and Circular Diagrams | Competitor Analysis | Scope ...
- Scope Diagrams


