This site uses cookies. By continuing to browse the ConceptDraw site you are agreeing to our Use of Site Cookies.

Basic Flowchart Symbols and Meaning

Flowchart Symbols and Meaning - Provides a visual representation of basic flowchart symbols and their proposed use in professional workflow diagram, standard process flow diagram and communicating the structure of a well-developed web site, as well as their correlation in developing on-line instructional projects. See flowchart's symbols by specifics of process flow diagram symbols and workflow diagram symbols.
How to Build a Flowchart
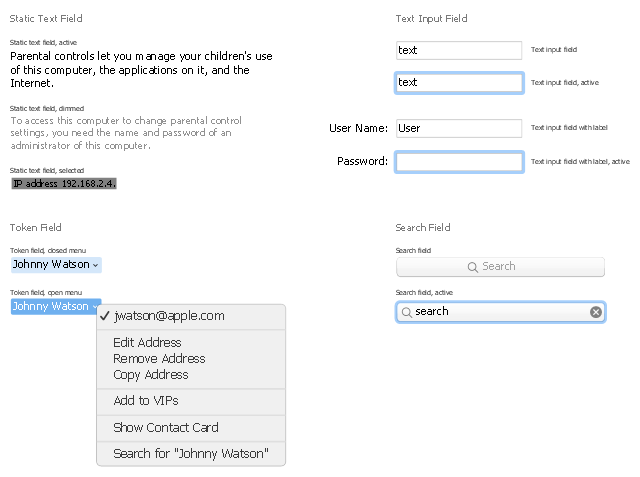
The vector stencils library "macOS Text Controls" contains 11 UI elements: static text field, text input field, token field, search field.
Use it for user interface design of your macOS applications with ConceptDraw PRO software.
The UI images example "Design elements - macOS Text Controls" is included in the macOS User Interface solution from the Software Development area of ConceptDraw Solution Park.
UI elements
UI elements, token field, text input field, editable text field, static text field, search field, search bar, menu symbol, checkmark, drawing shapes,

Data Flow Diagram

Data flow diagram (DFD) is the part of the SSADM method (Structured Systems Analysis and Design Methodology), intended for analysis and information systems projection. Data flow diagrams are intended for graphical representation of data flows in the information system and for analysis of data processing during the structural projection. Data flow diagram often used in connection with human process and can be displayed as workflow diagram. The critical Process Flow Diagram is another flowchart technique for designing data flow in connection with organizational processes. The critical Process flow diagram may use different range of symbols than a classic workflow diagram.

Keyboard Shortcuts and Mouse Actions

Mind map that details the various keyboard shortcuts and mouse actions that can be utilized in ConceptDraw MINDMAP.
The vector stencils library "Mac OS X Lion user interface" contains 52 UI design elements.
Use it for designing Mac OS X Lion graphic user interface (GUI) of software for Apple computers in the ConceptDraw PRO diagramming and vector drawing software extended with the Graphic User Interface solution from the Software Development area of ConceptDraw Solution Park.
Title Bar
Title Bar, title bar,
Title Bar Inactive
Title Bar Inactive, title bar,
Window
Window, window,
Window Inactive
Window Inactive, window,
Window Title Bar
Window Title Bar, window,
Window Title Bar (Inactive)
Window Title Bar (Inactive), window,
Full Screen Button
Full Screen Button, full screen button,
Exit Full Screen Button
Exit Full Screen Button, exit full screen button,
Window without Bar
Window without Bar, window,
Window (Narrow Toolbar)
Window (Narrow Toolbar), window,
Window Inactive (Narrow Toolbar)
Window Inactive (Narrow Toolbar), window,
Panel (Hud Window)
Panel (Hud Window), panel,
Panel (Hud Window) (Inactive)
Panel (Hud Window) (Inactive), panel,
Box 1
Box 1, box,
Box 2
Box 2, box,
Field
Field, field,
List View 1
List View 1, list view,
List View 2
List View 2, list view,
Scroll Bar Vertical
Scroll Bar Vertical, scroll bar,
Scroll Bar Horizontal
Scroll Bar Horizontal, scroll bar,
Main Menu
Main Menu, main menu,
Menu Bar
Menu Bar, menu bar,
Menu
Menu, menu,
Vertical Line
Vertical Line,
Horizontal Line
Horizontal Line,
Apple Menu
Apple Menu, Apple menu,
Arrow mark
Arrow mark, arrow,
Combo Box
Combo Box, combo box,
Pop Up Menu
Pop Up Menu, pop up menu,
Text Field
Text Field, text input field,
Count Button
Count Button, count button,
Search Field
Search Field, search field,
Check Box
Check Box, check box,
Check Box
Check Box, check box,
Group of Check Boxes
Group of Check Boxes, group of check boxes,
Radio Button
Radio Button, radio button,
Radio Button
Radio Button, radio button,
Group of Radio Buttons
Group of Radio Buttons, group of radio buttons,
Linear Slider (round thumb)
Linear Slider (round thumb), linear slider,
Linear Slider (directional thumb)
Linear Slider (directional thumb), linear slider,
Circular Slider
Circular Slider, circular slider,
Color Well
Color Well, color well,
Relevance Indicator
Relevance Indicator, relevance indicator,
Rating Indicator
Rating Indicator, rating indicator,
Indeterminate Progress Bar
Indeterminate Progress Bar, progress bar,
Determinate Progress Bar
Determinate Progress Bar, progress bar,
Continuous Capacity Indicator
Continuous Capacity Indicator, capacity indicator,
Discrete Capacity Indicator
Discrete Capacity Indicator, capacity indicator,
Discrete Capacity Indicator (yellow)
Discrete Capacity Indicator (yellow), capacity indicator,
Discrete Capacity Indicator (red)
Discrete Capacity Indicator (red), capacity indicator,
Asynchronous Progress Indicator
Asynchronous Progress Indicator, progress indicator,
Circular Progress Indicator
Circular Progress Indicator, progress indicator,
HelpDesk

How to Filter Data in Your Mind Map

Many of us use mind maps for organizing, structuring or compiling our ideas or projects. Making mind map is the ability to take existing ideas and combine them in new ways. This is much easier to do when you can see all the ideas in front of you. Using mind maps for organizing and structuring information as the volume of data grows and the map expands can be a challenge. ConceptDraw MINDMAP allows you to sort and filter your mind map content even on the Full Screen.

Electrical Symbols, Electrical Diagram Symbols

How to create Electrical Diagram? It’s very easy! All you need is a powerful software. It wasn’t so easy to create Electrical Symbols and Electrical Diagram as it is now with electrical diagram symbols offered by the libraries of Electrical Engineering Solution from the Industrial Engineering Area at the ConceptDraw Solution Park.
This solution provides 26 libraries which contain 926 electrical symbols from electrical engineering: Analog and Digital Logic, Composite Assemblies, Delay Elements, Electrical Circuits, Electron Tubes, IGFET, Inductors, Integrated Circuit, Lamps, Acoustics, Readouts, Logic Gate Diagram, MOSFET, Maintenance, Power Sources, Qualifying, Resistors, Rotating Equipment, Semiconductor Diodes, Semiconductors, Stations, Switches and Relays, Terminals and Connectors, Thermo, Transformers and Windings, Transistors, Transmission Paths,VHF UHF SHF.

Product Overview

ConceptDraw PRO offers a wide choice of powerful and easy-to-use tools for quickly creating all kinds of charts and diagrams. Even if you've never used a drawing tool before, it's very easy to create high-quality professional graphic documents with ConceptDraw PRO.

How to do presentation of Mind Maps via Skype conference call?

Tools to do presentation of mindmaps via Skype.
HelpDesk

How to Make SWOT Analysis in a Word Document

A SWOT analysis is a strategic planning tool that helps to identify and compare strengths and weaknesses with opportunities and threats to make a decision and create an action plan. When performing a SWOT analysis, one can create a table split up into four columns so as to list each impacting element side-by-side for comparison, but typically it is conducted using a four-square SWOT analysis template. Using mind map allows you to collect and structure an information involved in SWOT Analysis then, you can export your SWOT mind map into a MS Word document that allows you to present and collaborate your business strategic SWOT analysis matrix in MS Word document.