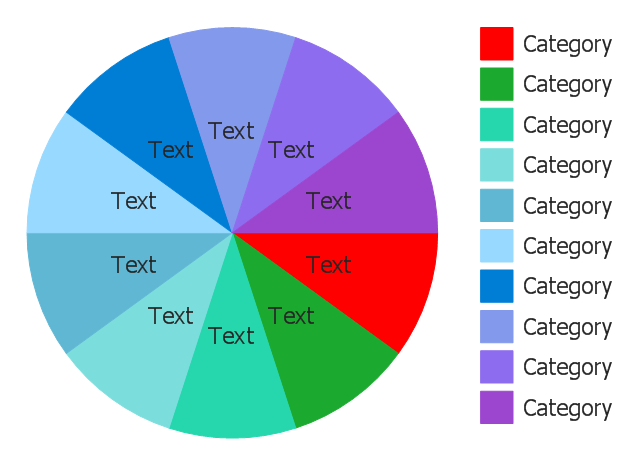
Use this circle chart template to design your sector diagrams.
"A chart is a graphical representation of data, in which the data is represented by symbols, such as ... slices in a pie chart. ... Charts are often used to ease understanding ... the relationships between parts of the data. ... For example, data that presents percentages in different groups (such as "satisfied, not satisfied, unsure") are often displayed in a pie chart ... A pie chart shows percentage values as a slice of a pie." [Chart. Wikipedia]
The template "Sector diagram" for the ConceptDraw PRO diagramming and vector drawing software is included in the Pie Charts solution of the Graphs and Charts area in ConceptDraw Solution Park.
Diagram Software - The Best Choice for Diagramming
For vector shapes and connector tools for quick and easy drawing diagrams for business, technology, science and education - The best choice for Diagramming is ConceptDraw PRO.
 Stakeholder Onion Diagrams
The Stakeholder Onion Diagram is often used as a way to view the relationships of stakeholders to a project goal. A basic Onion Diagram contains a rich information. It shows significance of stakeholders that will have has influence to the success achieve
HelpDesk
How to Create an IDEF0 Diagram for an Application Development
IDEF0 methods are intended to model the functions of a process, creating a graphical model that displays: what controls the function, who makes it, what resources are used and how they are connected with other functions. The IDEF0 tool is used to model the decisions, actions, and activities of a software system during the development process . IDEF0 diagram graphically depicts a model of a desired version of the application. ConceptDraw PRO allows you to create and communicate the IDEF0 diagrams of any complexity.- A Flow Diagram Of Primary Sector
- Sector diagram - Template | Food security assessment - Flowchart ...
- Business Sector Diagram Sample
- Sector diagram - Template. Economic sector weightings. Domestic ...
- Sector diagram - Template | Process Flowchart | How To Create ...
- Fishbone Diagram Example For Service Industry
- Sector diagram - Template | How To Create Onion Diagram ...
- Pie Chart Examples and Templates | Pie Charts | Sector diagram ...
- Sector diagram - Template | Process Flowchart | Bar Diagrams for ...
- Sector diagram - Template | How To Create Onion Diagram | Pie ...
- Sector diagram - Template | Circle Spoke Diagram Template | Pie ...
- Sector diagram - Template | Stakeholder Onion Diagrams | How To ...
- Sector diagram - Template | Process Flowchart | Secter Diagram
- Sector Diagram Is Also Known As
- Sector Diagram And Block Pie Diagram
- Er Diagram For Manufacturing Sector
- Fishbone Diagram For Telecom Sector
- Sector diagram - Template | Pie Chart Examples and Templates ...
- Primary Sector Secondary Sector And Tertiary Sector Flow Diagram
- Sector diagram - Template | Secure Wireless Network | How to ...


