Pie Chart Examples and Templates
A pie chart or a circle graph is a circular chart divided into sectors, illustrating numerical proportion. In a pie chart, the arc length of each sector and consequently its central angle and area, is proportional to the quantity it represents. Pie chart examples and templates created using ConceptDraw DIAGRAM software helps you get closer with pie charts and find pie chart examples suite your needs.Percentage Pie Chart. Pie Chart Examples
This sample was created in ConceptDraw DIAGRAM diagramming and vector drawing software using the Pie Charts Solution from Graphs and Charts area of ConceptDraw Solution Park. This sample shows the Pie Chart of the approximate air composition. You can see the percentage of oxygen, nitrogen and other gases in the air visualized on this Pie Chart.Pie Chart
ConceptDraw DIAGRAM diagramming and vector drawing software offers the Pie Charts solution from the Graphs and Charts area of ConceptDraw Solution Park for quick and easy drawing the Pie Chart of any complexity.Pie Donut Chart. Pie Chart Examples
This sample shows the Pie Donut Chart. It was created in ConceptDraw DIAGRAM diagramming and vector drawing software using the ready-to-use object from the Pie Charts Solution from Graphs and Charts area of ConceptDraw Solution Park. The Pie Donut Chart visualizes the percentage of parts of the whole and looks like as a ring divided into sectors. Pie Donut Charts are widely used in the business, statistics, analytics, mass media.Pie Chart Software
A pie chart is a circular diagram showing a set of data divided into proportional slices. There are several variations of this chart such as donut chart, exploded pie chart, multi-level pie charts. Although it is not very informative when a ring chart or circle chart has many sections, so choosing a low number of data points is quite important for a useful pie chart. ConceptDraw DIAGRAM software with Pie Charts solution helps to create pie and donut charts for effective displaying proportions in statistics, business and mass media for composition comparison, i.e. for visualization of part percentage inside one total.Basic Diagramming
Perfect charts and graphics diagramming software with rich examples and template. ConceptDraw is ideal to draw Charts and Graphics.
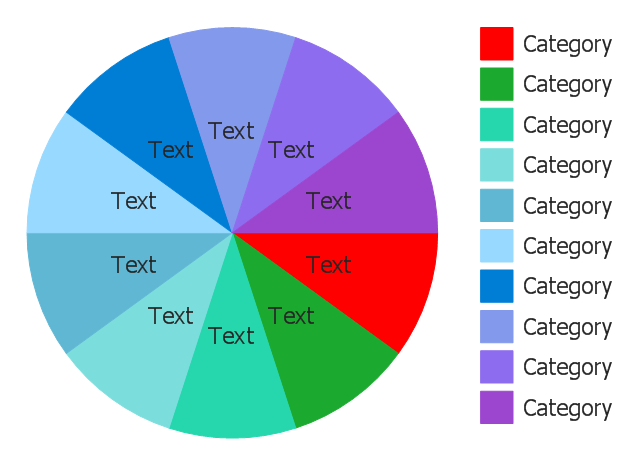
Use this circle chart template to design your sector diagrams.
"A chart is a graphical representation of data, in which the data is represented by symbols, such as ... slices in a pie chart. ... Charts are often used to ease understanding ... the relationships between parts of the data. ... For example, data that presents percentages in different groups (such as "satisfied, not satisfied, unsure") are often displayed in a pie chart ... A pie chart shows percentage values as a slice of a pie." [Chart. Wikipedia]
The template "Sector diagram" for the ConceptDraw PRO diagramming and vector drawing software is included in the Pie Charts solution of the Graphs and Charts area in ConceptDraw Solution Park.
 Pie Charts
Pie Charts are extensively used in statistics and business for explaining data and work results, in mass media for comparison (i.e. to visualize the percentage for the parts of one total), and in many other fields. The Pie Charts solution for ConceptDraw DIAGRAM offers powerful drawing tools, varied templates, samples, and a library of vector stencils for simple construction and design of Pie Charts, Donut Chart, and Pie Graph Worksheets.
Pie Chart Word Template. Pie Chart Examples
The Pie Chart visualizes the data as the proportional parts of a whole and looks like a disk divided into sectors. The pie chart is type of graph, pie chart looks as circle devided into sectors. Pie Charts are widely used in the business, statistics, analytics, mass media. It’s very effective way of displaying relative sizes of parts, the proportion of the whole thing.
 Basic Pie Charts
This solution extends the capabilities of ConceptDraw DIAGRAM (or later) with templates, samples, and a library of vector stencils for drawing pie and donut charts.
- Economic sector weightings | Chart Examples | Pie Chart Of Tertiary ...
- Process Flowchart | Types of Flowcharts | Pie Chart Examples and ...
- Sector diagram - Template | Economic sector weightings | New ...
- Color Pie Chart Primary Secondary Tertiary All Included
- Percentage Pie Chart . Pie Chart Examples | Atmosphere air ...
- Percentage Pie Chart . Pie Chart Examples | Sector diagram ...
- Best Value — Total Quality Management | Pie Chart Examples and ...
- Pie Charts | Pie Chart Examples and Templates | Sector diagram ...
- Sector weightings - Exploded pie chart | Pie Chart Of Primary ...
- Pie Chart Word Template


