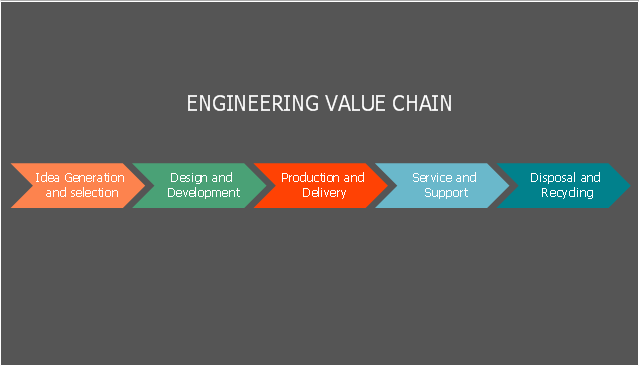
This step chart sample was created on the base of the webpage from the website Invest Punjab (Invest Punjab,
Punjab Bureau of Investment Promotion).
"Opportunities in Agro and Food Processing sector in Punjab:
(1) “Food Bowl of India” - Leading food producer of India with intensive cultivation of 2-3 crops per year.
(2) Highly mechanized agricultural practices with irrigation network available to 98% of the cultivable land.
(3) Robust infrastructure and a well developed ecosystem." [progressivepunjab.gov.in/ opportunitiesdetails.aspx?id=7]
The step chart example "Opportunities in agro and food processing sector in Punjab" was created using the ConceptDraw PRO diagramming and vector drawing software extended with the Marketing Diagrams solution from the Marketing area of ConceptDraw Solution Park.
- Flow Chart Sector Of Indian Economy
- Sector weightings - Exploded pie chart | Chart Templates | Pie Chart ...
- Sector diagram - Template | Economic sector weightings | Domestic ...
- Percentage Spider Chart | Geo Map - Asia - India | How To Do A ...
- Diagram And Pie Chart Of Bank Of India
- Food security assessment - Flowchart | Opportunities in agro and ...
- Pie Chart Examples and Templates | Process Flowchart | Bar ...
- Sector weightings - Exploded pie chart | Exploded pie chart ...
- Sector diagram - Template | Stakeholder Onion Diagrams | How To ...
- How to Draw the Different Types of Pie Charts | Percentage Pie ...
- Image chart - The total financing of the Philippines from 2001-2010 ...
- Basic Flowchart Symbols and Meaning | Flow chart Example ...
- Food Court | Health Food | How to Design a Food-related ...
- Block diagram - Selling technology patent process | Process ...
- Step chart - Template | Step chart - Cloud testing steps | Step chart ...
- SWOT Analysis | Swot Analysis Examples | UK Map | Example Of ...
- Forces shaping the broadband ecosystem in the US - Circle pie chart
- Talent management process | Electronic human resources (E-HR ...
- Pareto Chart | Seven Basic Tools of Quality - Pareto Chart | Design ...
- Yearly passing Bosphorus | Watercraft - Vector stencils library ...
