Pie Chart Software

HelpDesk
How To Create a Prioritization Matrix

Probability Quality Control Tools

CORRECTIVE ACTIONS PLANNING. Involvement Matrix


 Workflow Diagrams
Workflow Diagrams solution extends ConceptDraw PRO software with samples, templates and vector stencils library for drawing the work process flowcharts.
Business Process Elements: Choreographies
")

Prioritization Matrix

Cause and Effect Analysis

Collaboration in a Project Team

 PM Planning
This solution extends ConceptDraw MINDMAP and ConceptDraw Project software, allowing you to automatically create documents that reflect a project's status, for people who have different project roles.
Total Quality Management with ConceptDraw
 method - Fishbone diagram template")
 Seven Management and Planning Tools
Seven Management and Planning Tools solution extends ConceptDraw PRO and ConceptDraw MINDMAP with features, templates, samples and libraries of vector stencils for drawing management mind maps and diagrams.
 PM Agile
This solution extends ConceptDraw PRO software. All Agile meetings and documents are powered by mission adapted mind map templates, specially tuned for collaborative work.
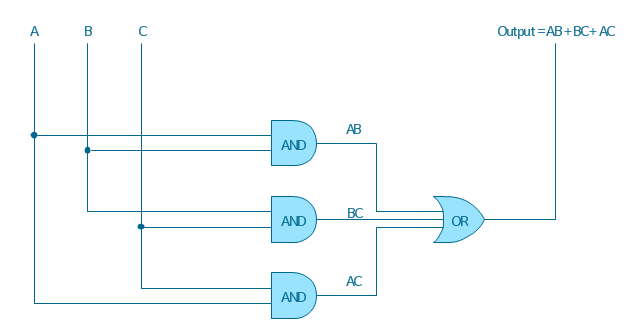
"A logic gate is an idealized or physical device implementing a Boolean function, that is, it performs a logical operation on one or more logical inputs, and produces a single logical output. Depending on the context, the term may refer to an ideal logic gate, one that has for instance zero rise time and unlimited fan-out, or it may refer to a non-ideal physical device...
Logic gates are primarily implemented using diodes or transistors acting as electronic switches, but can also be constructed using electromagnetic relays (relay logic), fluidic logic, pneumatic logic, optics, molecules, or even mechanical elements. With amplification, logic gates can be cascaded in the same way that Boolean functions can be composed, allowing the construction of a physical model of all of Boolean logic, and therefore, all of the algorithms and mathematics that can be described with Boolean logic.
Logic circuits include such devices as multiplexers, registers, arithmetic logic units (ALUs), and computer memory, all the way up through complete microprocessors, which may contain more than 100 million gates. In practice, the gates are made from field-effect transistors (FETs), particularly MOSFETs (metal–oxide–semiconductor field-effect transistors).
Compound logic gates AND-OR-Invert (AOI) and OR-AND-Invert (OAI) are often employed in circuit design because their construction using MOSFETs is simpler and more efficient than the sum of the individual gates.
In reversible logic, Toffoli gates are used." [Logic gate. Wikipedia]
The logic gate diagram template for the ConceptDraw PRO diagramming and vector drawing software is included in the Electrical Engineering solution from the Engineering area of ConceptDraw Solution Park.
Logic gate diagram
- Flow Chart In C To Find The Sum Of Gp Series
- Flow Chart Of The Sum Of The Gp Series
- Flowchart Or Algorithm Of Sum Of An G P Series
- Flow Chart Of Gp Series
- Draw A Flowchart To Find The Sum Of N Numbers
- Draw A Flowchart To Find The Sum Of Given N Number
- Draw A Flow Chart To Find The Sum Of N Number
- Flow Chart For G P Series
- Flowchart For Gp Series
- Flowchart To Find The Sum Of N Number
- G P Series Flowchart And Algorithm C Program Flowchart
- Entity-Relationship Diagram (ERD) | Sum Of N Nummber Flowchart
- Flow Chart Of Gp Series Program
- Basic Flowchart Symbols and Meaning | Bio Flowchart Lite ...
- C Program Flowchart G P Series
- Flowchart Of Sum Of N No
- Basic Flowchart Symbols and Meaning | Flow Chart Of Gp Series ...
- Solving quadratic equation algorithm - Flowchart | Basic Flowchart ...
- Algorithm And Flowchart For Sum Of N Numbers
- Basic Flowchart Symbols and Meaning | Definition Flowchart | How ...