Flow Chart Symbols

Cloud Computing Architecture Diagrams

Cross-Functional Flowchart


Examples of Flowcharts, Org Charts and More


Diagramming Software for Design UML Collaboration Diagrams


"A website, also written as Web site, web site, or simply site, is a set of related web pages served from a single web domain. A website is hosted on at least one web server, accessible via a network such as the Internet or a private local area network through an Internet address known as a Uniform resource locator. All publicly accessible websites collectively constitute the World Wide Web.
A webpage is a document, typically written in plain text interspersed with formatting instructions of Hypertext Markup Language (HTML, XHTML). A webpage may incorporate elements from other websites with suitable markup anchors.
Webpages are accessed and transported with the Hypertext Transfer Protocol (HTTP), which may optionally employ encryption (HTTP Secure, HTTPS) to provide security and privacy for the user of the webpage content. The user's application, often a web browser, renders the page content according to its HTML markup instructions onto a display terminal.
The pages of a website can usually be accessed from a simple Uniform Resource Locator (URL) called the web address. The URLs of the pages organize them into a hierarchy, although hyperlinking between them conveys the reader's perceived site structure and guides the reader's navigation of the site which generally includes a home page with most of the links to the site's web content, and a supplementary about, contact and link page." [Website. Wikipedia]
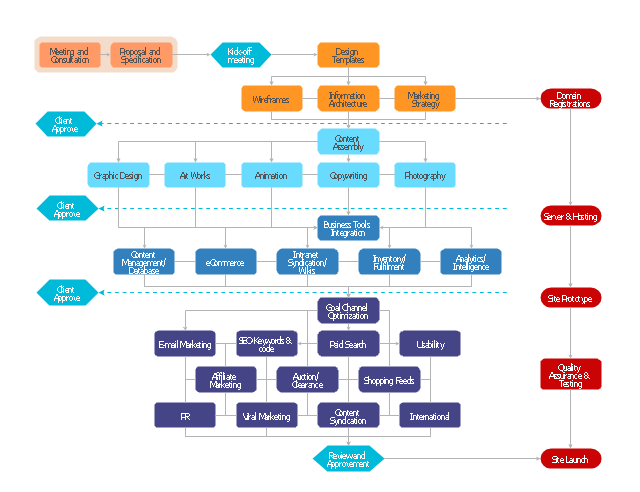
The flow chart example "Website launch" was created using the ConceptDraw PRO diagramming and vector drawing software extended with the Flowcharts solution from the area "What is a Diagram" of ConceptDraw Solution Park.
A webpage is a document, typically written in plain text interspersed with formatting instructions of Hypertext Markup Language (HTML, XHTML). A webpage may incorporate elements from other websites with suitable markup anchors.
Webpages are accessed and transported with the Hypertext Transfer Protocol (HTTP), which may optionally employ encryption (HTTP Secure, HTTPS) to provide security and privacy for the user of the webpage content. The user's application, often a web browser, renders the page content according to its HTML markup instructions onto a display terminal.
The pages of a website can usually be accessed from a simple Uniform Resource Locator (URL) called the web address. The URLs of the pages organize them into a hierarchy, although hyperlinking between them conveys the reader's perceived site structure and guides the reader's navigation of the site which generally includes a home page with most of the links to the site's web content, and a supplementary about, contact and link page." [Website. Wikipedia]
The flow chart example "Website launch" was created using the ConceptDraw PRO diagramming and vector drawing software extended with the Flowcharts solution from the area "What is a Diagram" of ConceptDraw Solution Park.
Flowchart - Website launch
Data Flow Diagram

The Best Mac Software for Diagramming or Drawing


Software and Database Design with ConceptDraw DIAGRAM

Network Diagram Software Logical Network Diagram


- UML communication diagram - Client server access | Flow Chart For ...
- Types Of Servers With Flow Chart
- Server Flowchart Symbol
- Flowchart With Server
- Accounting Information Systems Flowchart Symbols | Aerospace ...
- Flowchart Enum Server
- Flow Chart Symbols For File Server
- Server Interface Client Flowchart
- UML component diagram - Start server | Accounting Information ...