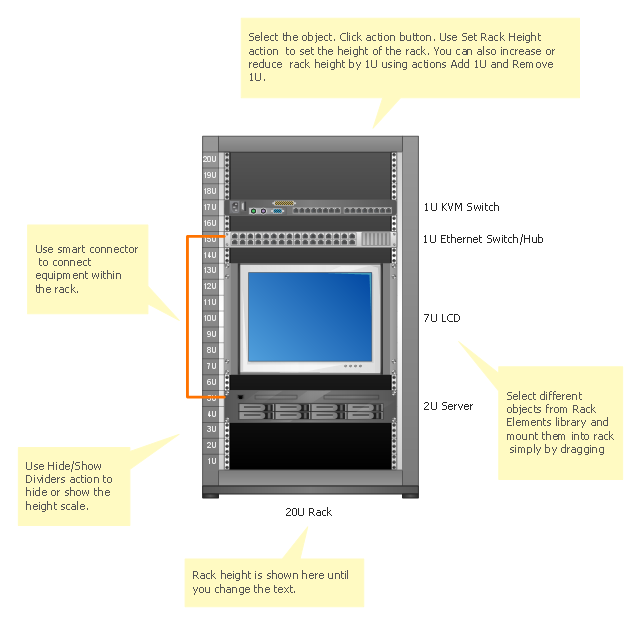
Server rack diagrams visualize the the rack mounting of computer and network equipment as the drawing of frontal view of the rack with equipment installed. They are used for choosing the equipment or racks to buy, and help to organize equipment on the racks virtually, without the real installation.
"A 19-inch rack is a standardized frame or enclosure for mounting multiple equipment modules. Each module has a front panel that is 19 inches (482.6 mm) wide, including edges or ears that protrude on each side which allow the module to be fastened to the rack frame with screws." [19-inch rack. Wikipedia]
"A rack unit, U or RU is a unit of measure that describes the height of equipment designed to mount in a 19-inch rack or a 23-inch rack. The 19-inch (482.6 mm) or 23-inch (584.2 mm) dimension refers to the width of the equipment mounting frame in the rack including the frame; the width of the equipment that can be mounted inside the rack is less. One rack unit is 1.75 inches (4.445 cm) high.
The size of a piece of rack-mounted equipment is frequently described as a number in "U". For example, one rack unit is often referred to as "1U", 2 rack units as "2U" and so on.
A typical full size rack is 42U, which means it holds just over 6 feet of equipment, and a typical "half-height" rack would be 18-22U, or around 3 feet high." [Rack unit. Wikipedia]
The rack diagram template is included in the Rack Diagrams solution from the Computer and Networks area of ConceptDraw Solution Park.
Rack diagram template
HelpDesk
How to Add a Rack Diagram to a PowerPoint Presentation

Cisco Routers. Cisco icons, shapes, stencils and symbols

ConceptDraw DIAGRAM Compatibility with MS Visio

 Azure Architecture
Azure Architecture solution bundles into one handy tool everything you need to create effective Azure Architecture diagrams. It adds the extra value to versatile ConceptDraw DIAGRAM software and extends the users capabilities with comprehensive collection of Microsoft Azure themed graphics, logos, preset templates, wide array of predesigned vector symbols that covers the subjects such as Azure management, Azure storage, and Azure services, amongst others, and allow you to illustrate Azure Architecture diagrams at any degree of complexity, to present visually your Azure cloud system architecture with professional style, to design Azure cloud topology, to document Windows Azure Architecture and Azure Cloud System Architecture, to visualize the great abilities and work of Microsoft Azure Cloud System and Azure services.
HelpDesk
How to Resize Objects
ConceptDraw Arrows10 Technology

 Telecommunication Network Diagrams
Telecommunication Network Diagrams solution extends ConceptDraw DIAGRAM software with samples, templates, and great collection of vector stencils to help the specialists in a field of networks and telecommunications, as well as other users to create Computer systems networking and Telecommunication network diagrams for various fields, to organize the work of call centers, to design the GPRS networks and GPS navigational systems, mobile, satellite and hybrid communication networks, to construct the mobile TV networks and wireless broadband networks.
ER Diagram for Cloud Computing

ConceptDraw DIAGRAM Comparison with Omnigraffle Professional and MS Visio

How to Build Cloud Computing Diagram Principal Cloud Manufacturing

 ATM UML Diagrams
The ATM UML Diagrams solution lets you create ATM solutions and UML examples. Use ConceptDraw DIAGRAM as a UML diagram creator to visualize a banking system.
Network Topology Mapper
 Computer and Network Package
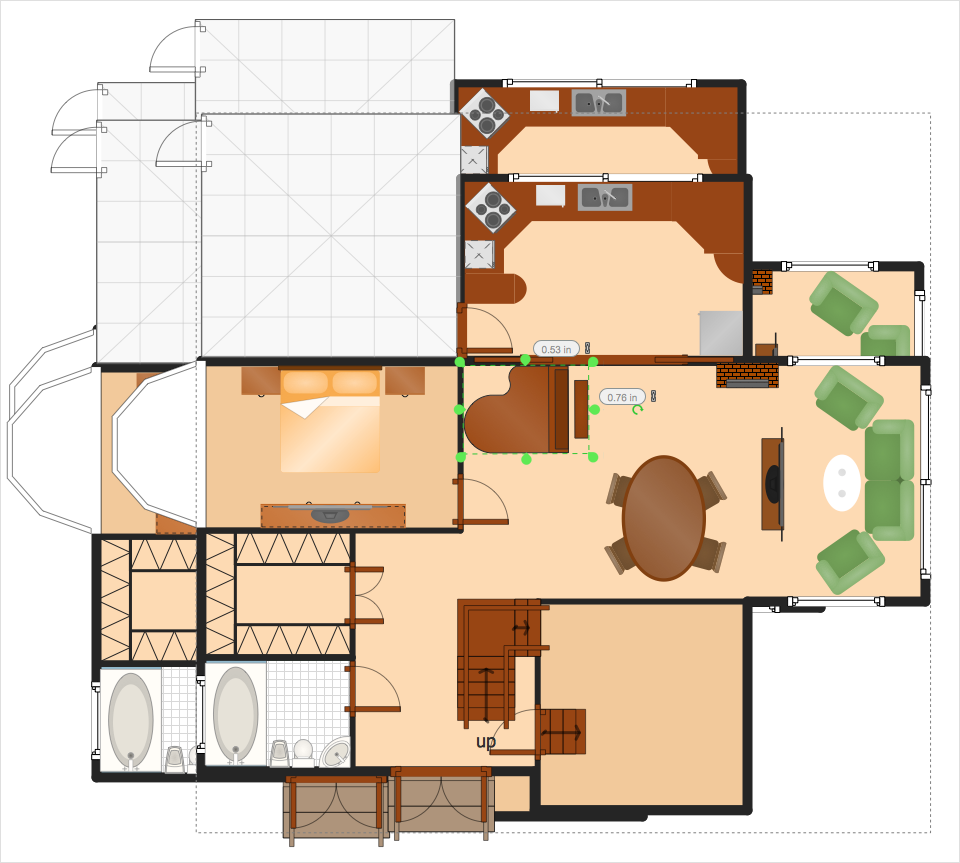
Computer and Network Package is a large set of valuable graphical solutions from ConceptDraw Solution Park, developed and specially selected to help computer network specialists and IT professionals to realize their daily work the most efficiently and quickly. This package contains extensive set of graphic design tools, ready-to-use vector elements, built-in templates and samples for designing professional-looking diagrams, charts, schematics and infographics in a field of computer network technologies, cloud computing, vehicular networking, wireless networking, ensuring networks security and networks protection. It is useful for designing different floor plans and layout plans for homes, offices, hotels and instantly construction detailed schemes of computer networks and wireless networks on them, for making professional-looking and colorful Pie Charts, Bar Graphs and Line Charts visualizing the relevant information and data.
- Server Rack Shelf Png Front View
- Rack Switches Cisco Front View
- Fiber Panel Front View
- Rack diagrams - Vector stencils library | Rack diagram - Template ...
- Rack diagrams - Vector stencils library | Cisco Routers. Cisco icons ...
- Server Rack Cabinet Vector
- Office Layout Plans | Cupboard Png Top View
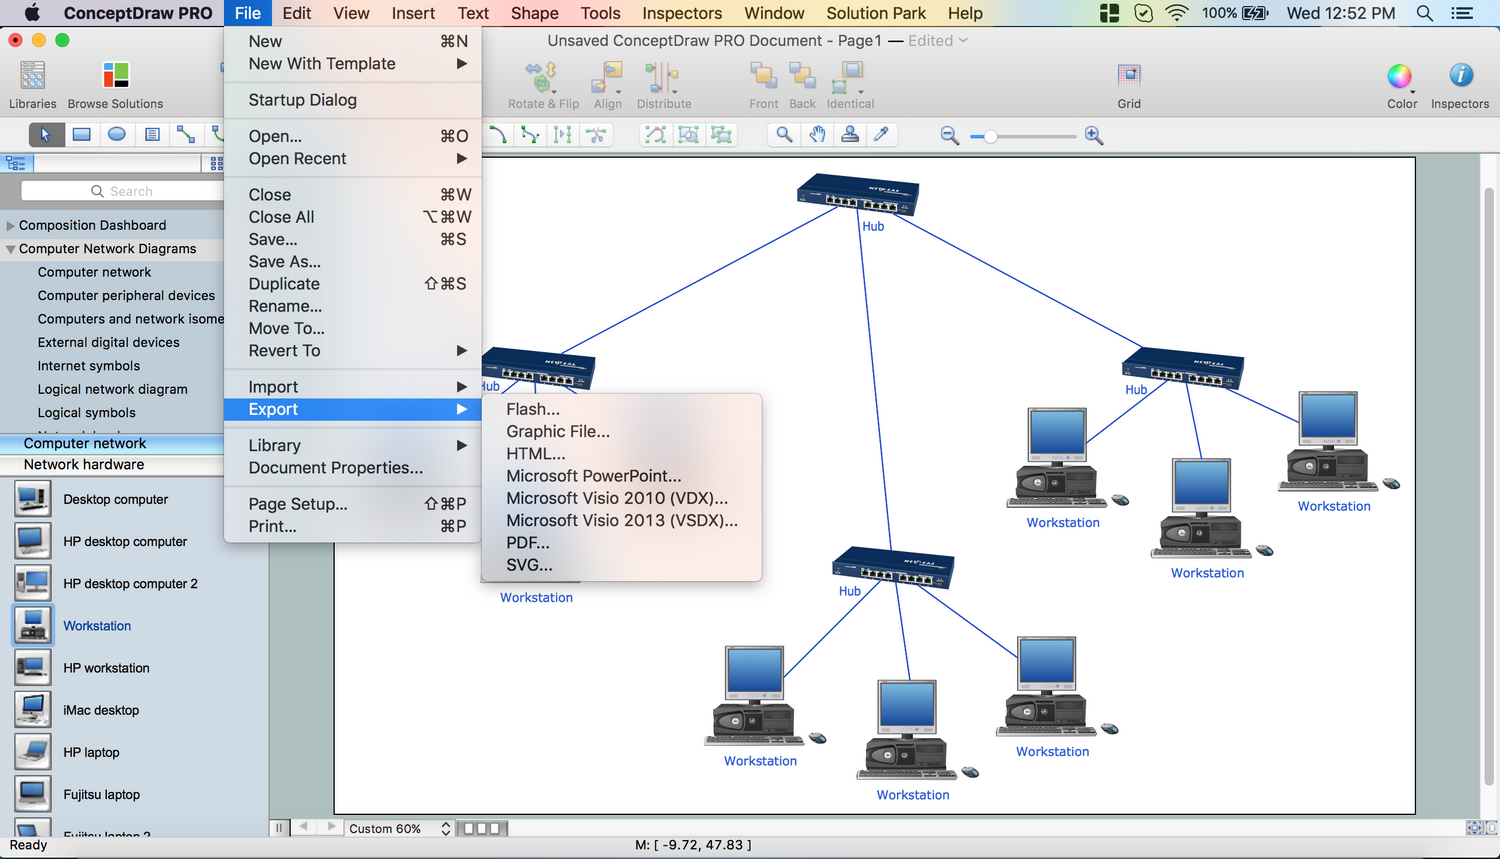
- Rack Diagrams | How to Create a Rack Diagram in ConceptDraw ...
- How To use Switches in Network Diagram | Rack diagram ...
- Server | Rack Diagrams | Racking | Computer Server Rack Png
- Server hardware - Rack diagram | Network Diagramming Software ...
- Computer Server Diagram
- Server Rack Diagram Software
- Rack Network Switch
- Server Rack Equipment Layout
- Server hardware - Rack diagram | Rack Diagrams | Server ...
- Servers In Rack Front Png
- Network Server Rack Diagram
- Rack diagrams - Vector stencils library | Server hardware - Rack ...
- Rack Server U