Diagramming tool - Amazon Web Services and Cloud Computing Diagrams
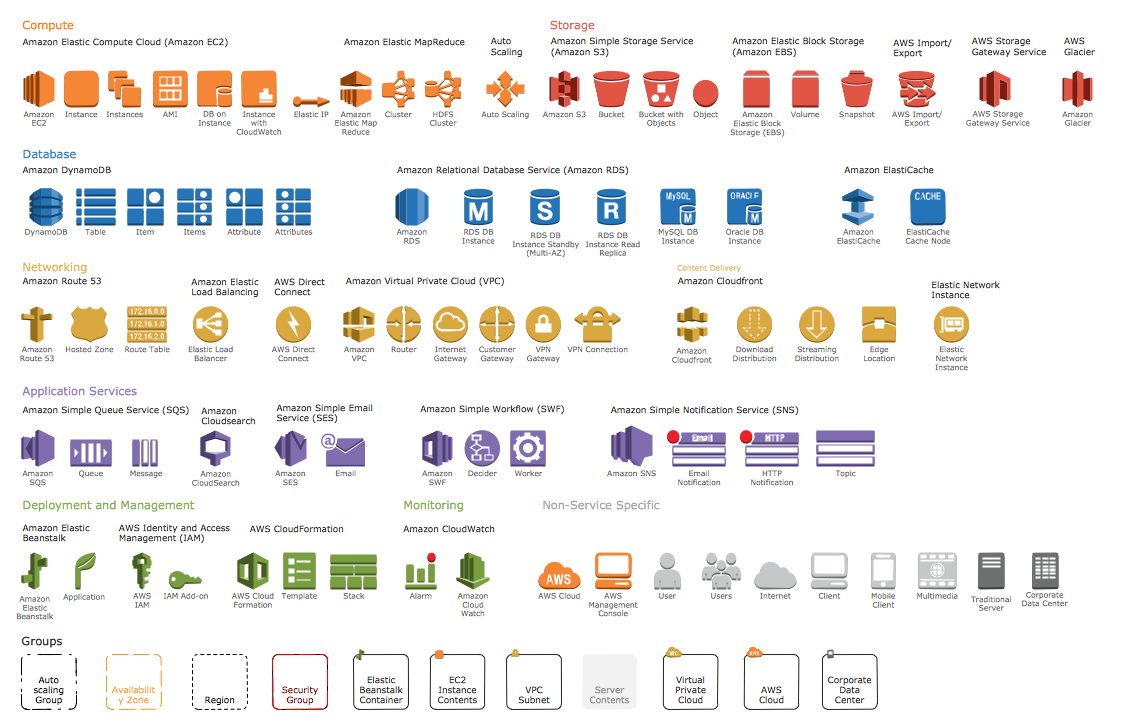
The AWS Architecture Diagrams solution includes icons, sample and templates for several Amazon Web Services products and resources, to be used when creating architecture diagrams. The icons are designed to be simple so that you can easily incorporate them in your diagrams and put them in your whitepapers, presentations, datasheets, posters or any technical material you like.Export from ConceptDraw PRO Document to a Graphic File
Now it’s easy to share your visual documents with other people in a form most convenient for them. ConceptDraw PRO can save your drawings and diagrams in a number of highly useful formats, including graphic files. You can save your drawing as a .PNG, .JPG, or other graphic format file.
Process Flowchart
The main reason of using Process Flowchart or PFD is to show relations between major parts of the system. Process Flowcharts are used in process engineering and chemical industry where there is a requirement of depicting relationships between major components only and not include minor parts. Process Flowcharts for single unit or multiple units differ in their structure and implementation. ConceptDraw PRO is Professional business process mapping software for making Process flowcharts, Process flow diagram, Workflow diagram, flowcharts and technical illustrations for business documents and also comprehensive visio for mac application. Easier define and document basic work and data flows, financial, production and quality management processes to increase efficiency of your business with ConcepDraw PRO. Business process mapping software with Flowchart Maker ConceptDraw PRO includes extensive drawing tools, rich examples and templates, process flowchart symbols and shape libraries, smart connectors that allow you create the flowcharts of complex processes, process flow diagrams, procedures and information exchange. Process Flowchart Solution is project management workflow tools which is part ConceptDraw Project marketing project management software. Drawing charts, diagrams, and network layouts has long been the monopoly of Microsoft Visio, making Mac users to struggle when needing such visio alternative like visio for mac, it requires only to view features, make a minor edit to, or print a diagram or chart. Thankfully to MS Visio alternative like ConceptDraw PRO software, this is cross-platform charting and business process management tool, now visio alternative for making sort of visio diagram is not a problem anymore however many people still name it business process visio tools.
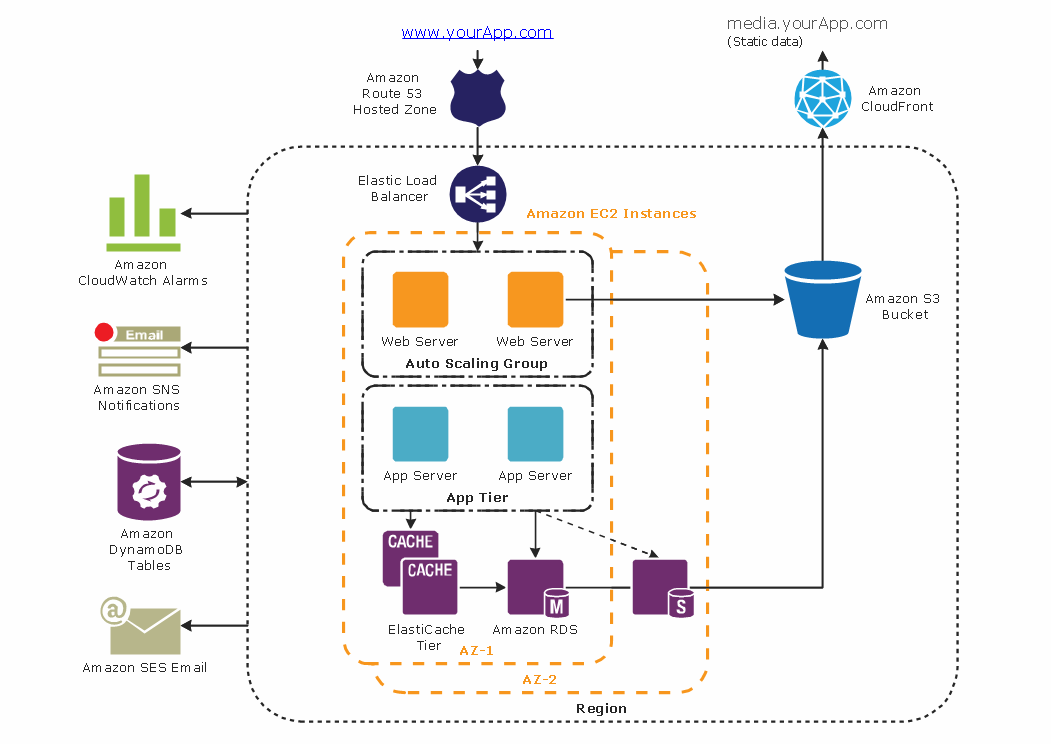
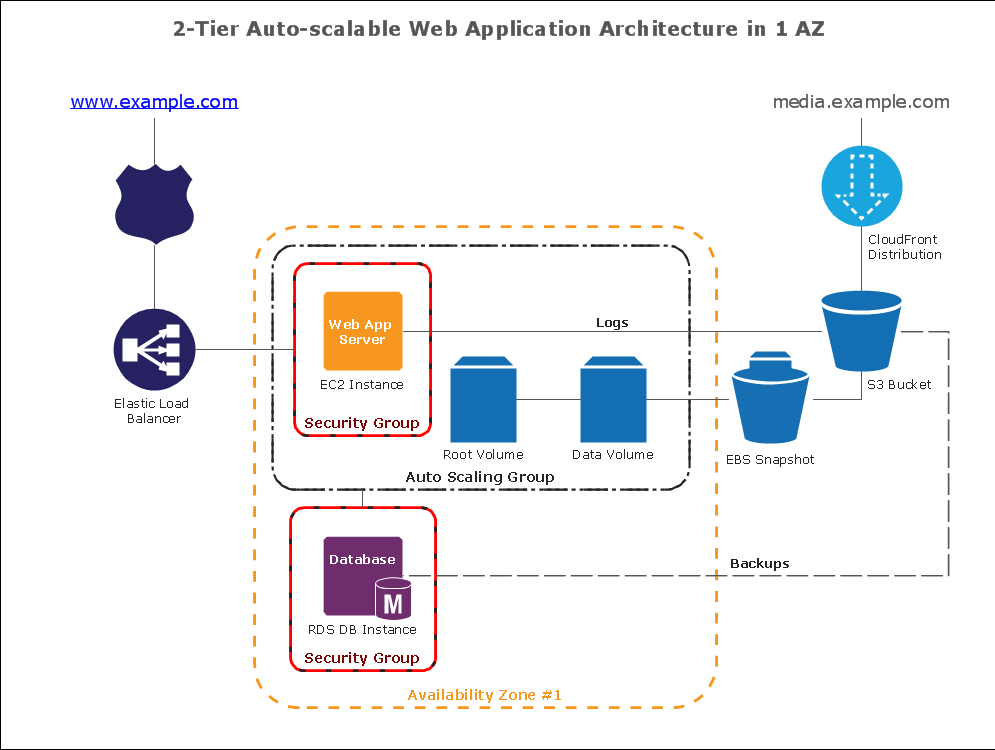
Amazon Web Services Diagrams diagramming tool for architecture
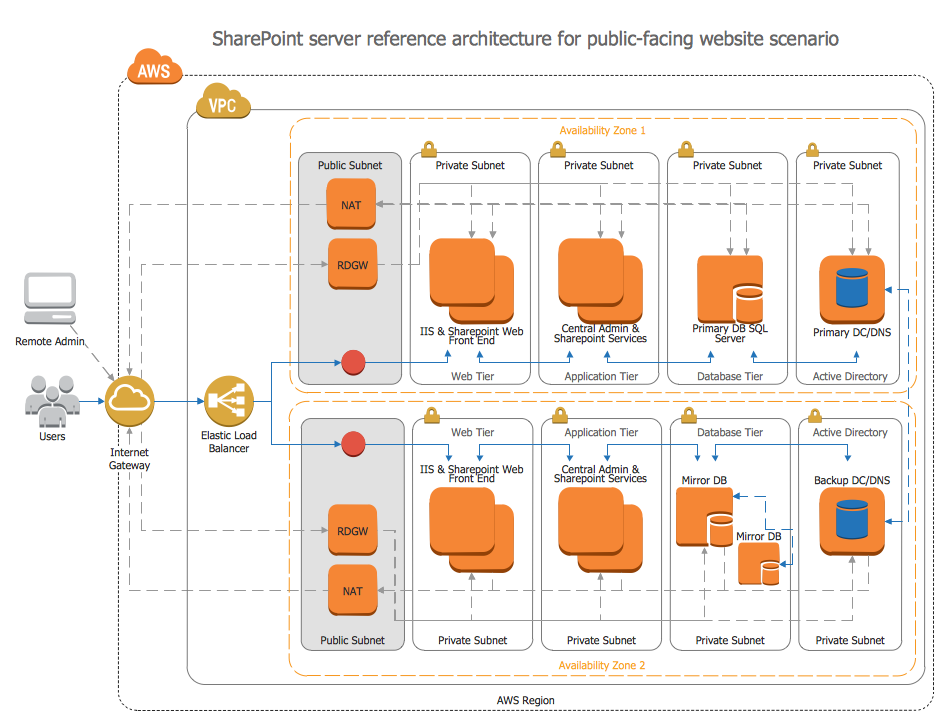
Amazon Web Services (AWS) offers the reliable and relatively inexpensive cloud computing services. This is the main reason why many large companies prefer to use the Amazon Cloud to storage and operate the data. ConceptDraw PRO diagramming software enhanced with AWS Architecture Diagrams solution provides the powerful AWS diagramming tools to draw the Amazon architecture diagrams and Amazon Web Services planning diagrams, to develop the Architect infrastructure based on AWS in a few minutes. The AWS Architecture Diagrams solution offers variety of built-in samples and templates for several Amazon Web Services products and resources, a wide range of predesigned and recognizable vector graphic icons used for simple designing the Architecture diagrams. The diagrams created in ConceptDraw PRO are professional-looking, helpful when designing and implementing the AWS infrastructure based systems, useful to communicate design, deployment and topology, and apposite for using in presentations, whitepapers, datasheets, posters, and other technical materials you like.
 Computer Network Diagrams
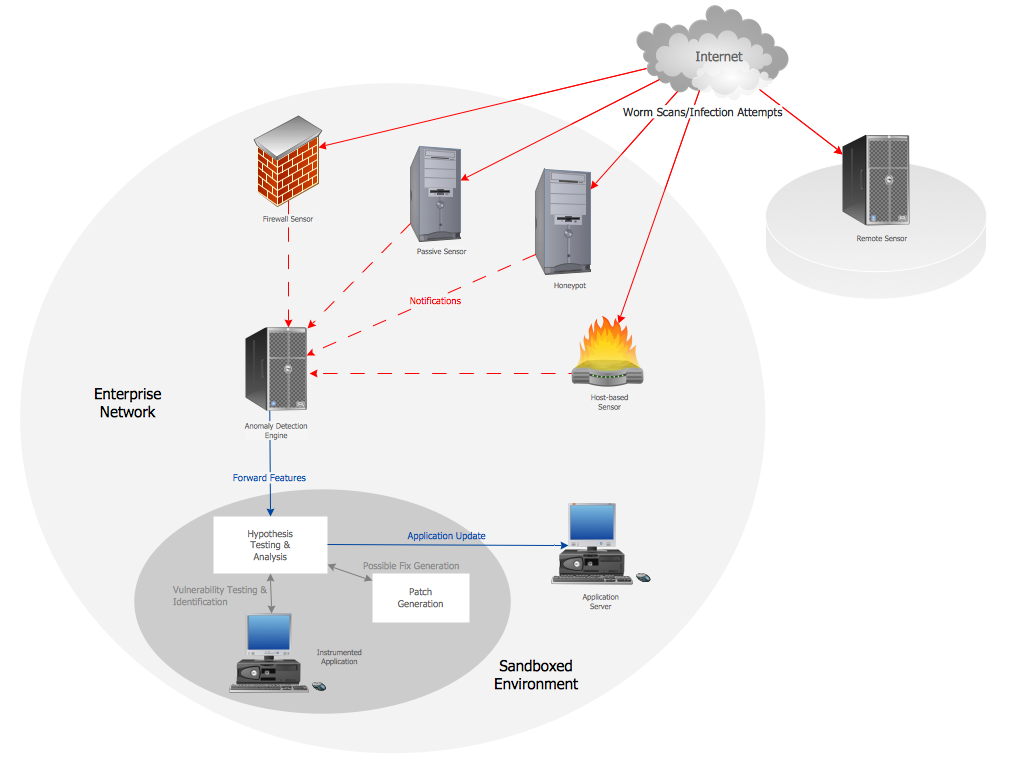
Computer Network Diagrams solution extends ConceptDraw PRO software with samples, templates and libraries of vector icons and objects of computer network devices and network components to help you create professional-looking Computer Network Diagrams, to plan simple home networks and complex computer network configurations for large buildings, to represent their schemes in a comprehensible graphical view, to document computer networks configurations, to depict the interactions between network's components, the used protocols and topologies, to represent physical and logical network structures, to compare visually different topologies and to depict their combinations, to represent in details the network structure with help of schemes, to study and analyze the network configurations, to communicate effectively to engineers, stakeholders and end-users, to track network working and troubleshoot, if necessary.
How To create Diagrams for Amazon Web Services architecture
Want to create Diagrams for Amazon Web Services architecture? ConceptDraw Solution Park with AWS architecture Solution will help you!Active Directory Domain Services
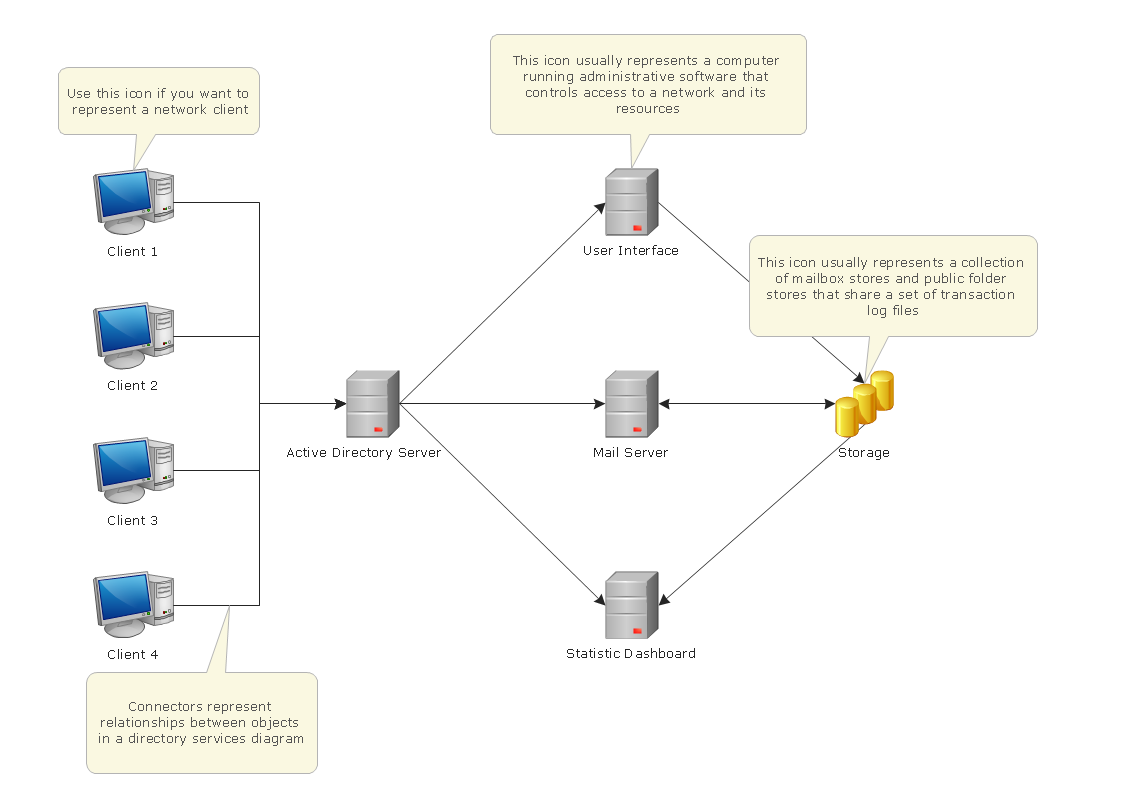
Active Directory Diagrams visualize the detailed structures of the Microsoft Windows networks, Active Directory Domain topology, the Active Directory Site topology, the Organizational Units (OU), and the Exchange Server Organization.AWS Simple Icons for Architecture Diagrams
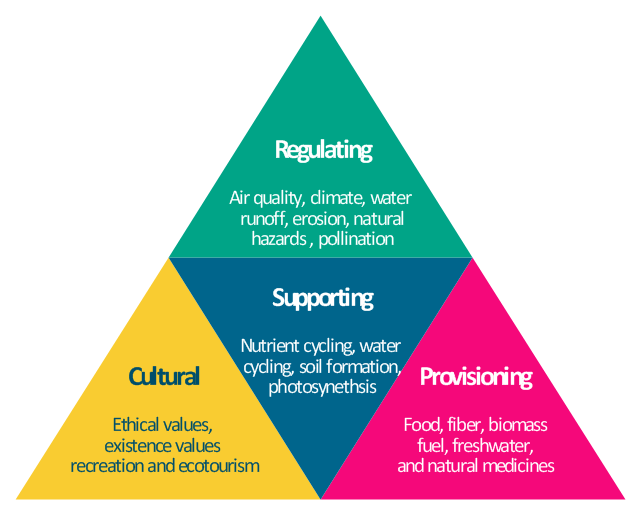
The AWS Architecture Diagrams solution includes icons, sample and templates for several Amazon Web Services products and resources, to be used when creating architecture diagrams. The icons are designed to be simple so that you can easily incorporate them in your diagrams and put them in your whitepapers, presentations, datasheets, posters or any technical material you like."Ecosystems represent sources of natural capital and provide goods and services to society, also called ecosystem services. The Millennium Ecosystem Assessment identified over 24 ecosystem services that can be divided up into 4 general groups including: 1) provisioning, 2) supporting, 3) regulating and 4) cultural." [User:Sawtoothgirl/ Sustainable Real Estate Development. Wikipedia]
"Humankind benefits in a multitude of ways from ecosystems. Collectively, these benefits are known as ecosystem services. Ecosystem services are regularly involved in the provisioning of clean drinking water and the decomposition of wastes. While scientists and environmentalists have discussed ecosystem services implicitly for decades, these the ecosystem services concept itself was popularized by the Millennium Ecosystem Assessment (MA) in the early 2000s. This grouped ecosystem services into four broad categories: provisioning, such as the production of food and water; regulating, such as the control of climate and disease; supporting, such as nutrient cycles and crop pollination; and cultural, such as spiritual and recreational benefits. To help inform decision-makers, many ecosystem services are being assigned economic values." [Ecosystem services. Wikipedia]
The segmented pyramid diagram example "Ecosystem goods and services" was redesigned using the ConceptDraw PRO diagramming and vector drawing software from Wikimedia Commons file ES_ triangle.png.
[commons.wikimedia.org/ wiki/ File:ES_ triangle.png]
This file is licensed under the Creative Commons Attribution-Share Alike 3.0 Unported license. [creativecommons.org/ licenses/ by-sa/ 3.0/ deed.en]
This segmented pyramid diagram example "Ecosystem goods and services" is included in the Pyramid Diagrams solution from the Marketing area of ConceptDraw Solution Park.
IDEF0 standard with ConceptDraw PRO
The activity of any organization is more or less branchy network of processes. The description of these processes is a hard technical task which requires definite methodology and standards. According to the IDEF0 standard any process can be described in the form of a block (Activity Box) which has inputs and outputs. The process consists in transformation of inputs into outputs under the influence of the management and in the presence of necessary resources. Outputs of the given process later on can be either inputs for the next process or resources, or management means.Computer Network Architecture. Computer and Network Examples
The network architecture and design specialization will help you gain the technical leadership skills you need to design and implement high-quality networks that support business needs.
Amazon Web Services
ConceptDraw PRO is a powerful diagramming and vector drawing software. Extended with AWS Architecture Diagrams Solution from the Computer and Networks Area, ConceptDraw PRO now is ideal software for Amazon Web Services diagrams drawing."Dimensions of service quality.
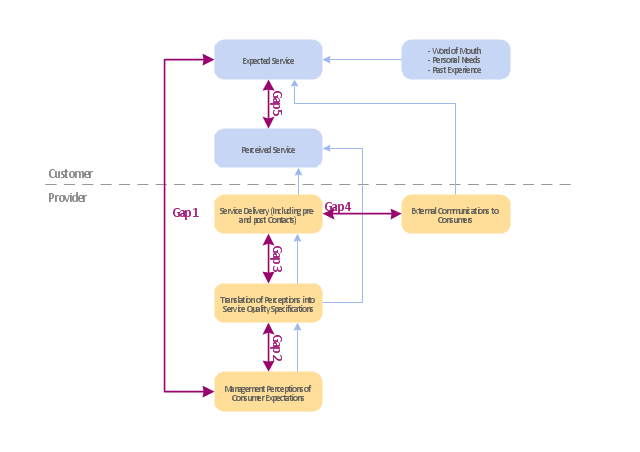
A customer's expectation of a particular service is determined by factors such as recommendations, personal needs and past experiences. The expected service and the perceived service sometimes may not be equal, thus leaving a gap. The service quality model or the ‘GAP model’ developed by a group of authors- Parasuraman, Zeithaml and Berry at Texas and North Carolina in 1985 , highlights the main requirements for delivering high service quality. It identifies five ‘gaps’ that cause unsuccessful delivery. Customers generally have a tendency to compare the service they 'experience' with the service they 'expect' . If the experience does not match the expectation , there arises a gap. Ten determinants that may influence the appearance of a gap were described by Parasuraman, Zeithaml and Berry. in the SERVQUAL model: reliability, responsiveness, competence, access, courtesy, communication, credibility, security, understanding the customer and tangibles.
Later, the determinants were reduced to five: tangibles; reliability; responsiveness; service assurance and empathy in the so called RATER model." [Service quality. Wikipedia]
The block diagram example "Gap model of service quality" was created using the ConceptDraw PRO diagramming and vector drawing software extended with the Block Diagrams solution from the area "What is a Diagram" of ConceptDraw Solution Park.
Taxi Service Data Flow Diagram DFD Example
This sample shows the Data Flow Diagram of the Taxi Service and interactions between the Clients, Operators and Divers, as well as Orders and Reports databases.- Cloud Service Png
- Amazon Web Services Diagrams diagramming tool for architecture ...
- Process Flowchart | Amazon Web Services Diagrams diagramming ...
- Computer Software Icon Png
- Ecosystem goods and services - Segmented pyramid diagram ...
- Active Directory Diagram | Active Directory Domain Services | Active ...
- Architectural Software Icon Png File
- Amazon Web Services Diagrams diagramming tool for architecture ...
- Taxi Service Data Flow Diagram DFD Example | Road Transport ...
- Last resort hotel book room process - DFD | Amazon Web Services ...
- ConceptDraw Solution Park | Amazon Web Services Diagrams ...
- Amazon Web Services Diagrams diagramming tool for architecture ...
- Global Payment Solutions | UML activity diagram - Payment process ...
- Taxi Service Data Flow Diagram DFD Example | Workflow Diagram ...
- Active Directory Domain Services | Active Directory Diagram ...
- Diagramming tool - Amazon Web Services and Cloud Computing ...
- Amazon Web Services Diagrams diagramming tool for architecture ...
- Diagramming tool - Amazon Web Services and Cloud Computing ...
- Amazon Web Services Diagrams diagramming tool for architecture ...
- Amazon Web Services Diagrams diagramming tool for architecture ...
