 Sales Dashboard
Sales Dashboard solution extends ConceptDraw PRO software with templates, samples and library of vector stencils for drawing the visual dashboards of sale metrics and key performance indicators (KPI).
 ConceptDraw Solution Park
ConceptDraw Solution Park collects graphic extensions, examples and learning materials
 25 Typical Orgcharts
The 25 Typical Orgcharts solution contains powerful organizational structure and organizational management drawing tools, a variety of professionally designed organization chart and matrix organization structure samples, 25 templates based on various orga
 PM Dashboards
This solution extends ConceptDraw PRO and ConceptDraw PROJECT software with the ability to clearly display the identified key performance indicators for any project.
 Management Area
The solutions from Management area of ConceptDraw Solution Park collect templates, samples and libraries of vector stencils for drawing the management diagrams and mind maps.
 Marketing Area
The solutions from Marketing area of ConceptDraw Solution Park collect templates, samples and libraries of vector stencils for drawing the marketing diagrams and mind maps.
 Project Management Area
Project Management area provides Toolbox solutions to support solving issues related to planning, tracking, milestones, events, resource usage, and other typical project management functions.
 PM Planning
This solution extends ConceptDraw MINDMAP and ConceptDraw Project software, allowing you to automatically create documents that reflect a project's status, for people who have different project roles.
 PM Presentations
This solution extends ConceptDraw MINDMAP and ConceptDraw PRO software, improving the efficiency of the project management process by using the same source data to build targeted presentations.
 Entity-Relationship Diagram (ERD)
Entity-Relationship Diagram (ERD) solution extends ConceptDraw PRO software with templates, samples and libraries of vector stencils from drawing the ER-diagrams by Chen's and crow’s foot notations.
HelpDesk
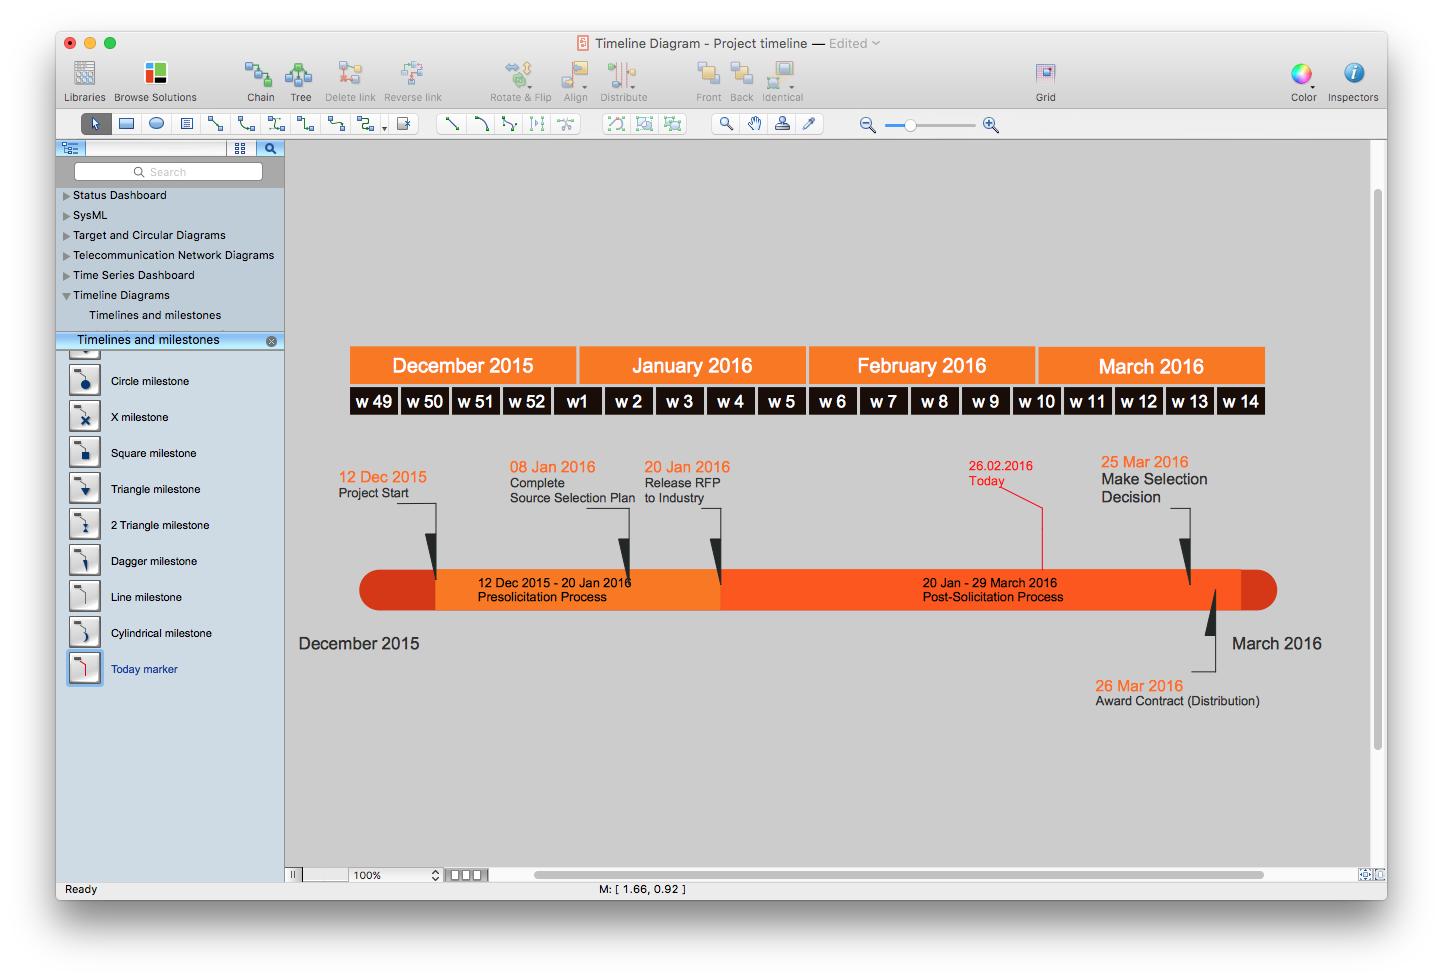
How to Create a Timeline Diagram in ConceptDraw PRO
A Timeline is a chart which displays a project plan schedule in chronological order. A Timeline is used in project management to depict project milestones and visualize project phases, and show project progress. The graphic form of a timeline makes it easy to understand critical project milestones, such as the progress of a project schedule. Timelines are particularly useful for project scheduling or project management when accompanied with a Gantt chart. It captures the main of what the project will accomplish and how it will be done. making a project timeline is one of the most important skills a project manager needs have. Making comprehensive, accurate timelines allows you getting every project off in the best way. ConceptDraw PRO allows you to draw a timeline charts using special library.
 PM Response
This solution extends all ConceptDraw Office 2.0 products by helping to improve the response time to project changes. PM Response also helps with iteration planning, discussing project layout approaches, and solving project challenges.
 Project Exchange
This solution extends ConceptDraw PROJECT and ConceptDraw MINDMAP software with the ability to import and export project data.
- Management Activities
- Performance Indicators | Enterprise dashboard | KPI Dashboard ...
- Sales metrics and KPIs - Visual dashboard | Sales dashboard ...
- Sales dashboard - Vector stencils library | Sales dashboard - Vector ...
- Business Report Pie. Pie Chart Examples | Reporting & Data ...
- Management indicators - Vector stencils library | Education ...
- Pie Chart Examples and Templates | Examples of Flowcharts, Org ...
- A KPI Dashboard . Visualizing Sales Data. To See How Your | Meter ...
- Gant Chart in Project Management | How to Use ConceptDraw ...
- Sales dashboard - Vector stencils library | Sales dashboard - Vector ...
- Schedule pie chart - Daily action plan | Basic Diagramming | Pie ...
- Dashboard Charts
- Time Management Tables And Pie Charts
- PM Personal Time Management | Schedule pie chart - Daily action ...
- Website metrics - Visual dashboard | Website traffic dashboard ...
- Business Report Pie. Pie Chart Examples | Design elements - Sales ...
- Sales manager dashboard | ConceptDraw PRO | Inventory ...
- How to Report Task's Execution with Gantt Chart | Gant Chart in ...
- Status Dashboard | Project task status dashboard - Template | PM ...
- Design elements - Meter indicators | Meter indicators 2 - Vector ...

