HelpDesk
How to Draw a Circular Arrows Diagram
The cyclic recurrence is a fundamental property of multiple systems. The cycle is a process which consists from elements (phases, stages, stages) following each other. Many processes in astronomy, biology, chemistry, physics, mathematics, etc. have a cycle properties. It is also widely used in information technologies and marketing analysis. Graphical representation of cyclic processes can have many forms. It can be a circle, parabola, hyperbola, ellipse and others. A Circular Arrows Diagram is used as one of the statistical charts in the business, mass media and marketing. ConceptDraw DIAGRAM provides its users tools for making easy drawing Circular Arrows Diagrams.HelpDesk
How to Draw Geometric Shapes
Knowledge of geometry grants people good logic, abstract and spatial thinking skills. The object of study of geometry is the size, shape and position, the 2-dimensional and 3-dimensional shapes. Geometry is related to many other areas in math and is used daily by engineers, architects, designers, and many other professionals. Today, the objects of geometry are not only shapes and solids. It deals with properties and relationships and looks much more about analysis and reasoning. Geometry drawings can be helpful when you study geometry or need to illustrate some investigation related to geometry. ConceptDraw DIAGRAM allows you to draw plane and solid geometry shapes quickly and easily.Agile Methodology
Agile methodology is an excellent alternative to waterfall and traditional sequential development. ConceptDraw DIAGRAM software extended with SCRUM Workflow solution is ideal for quick and easy designing various diagrams, charts, mind maps and schematics illustrating software development using Agile methodologies, and in particular Scrum methodology.HelpDesk
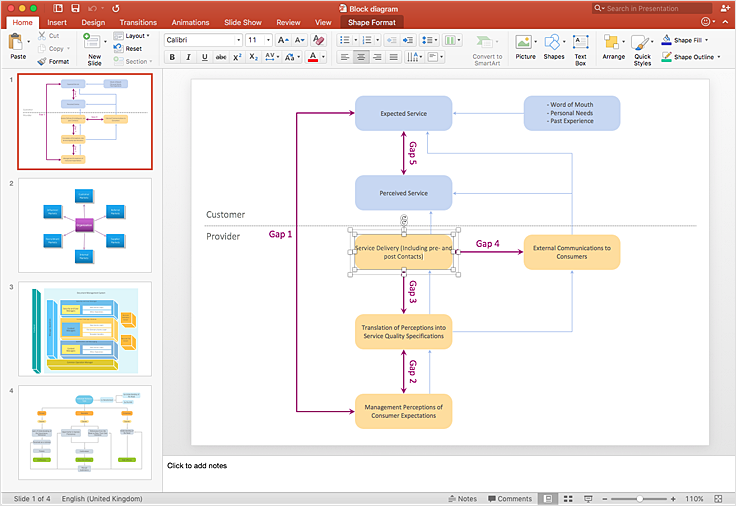
How to Add a Block Diagram to a PowerPoint Presentation
A block diagram is a useful tool both in designing new processes, and in improving existing. A block diagram is a type of chart, which is often used in presentations, because of its universality - the graphic blocks can be applied to many processes.The PowerPoint presentation of major process steps and key process participants can be very informative and helpful. Using ConceptDraw DIAGRAM , you can easily convert a block diagram to MS PowerPoint presentation.HelpDesk
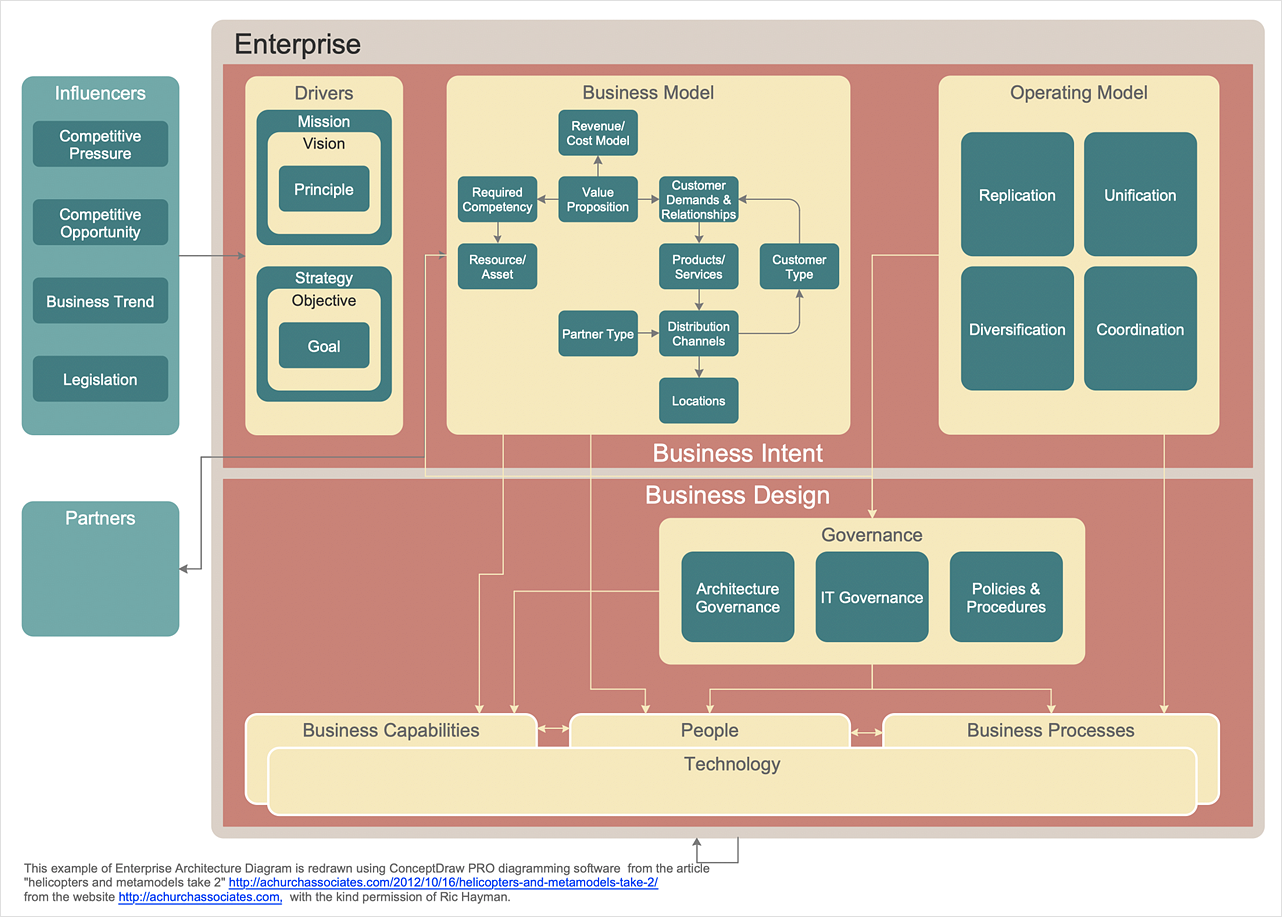
How to Create an Enterprise Architecture Diagram
An Enterprise Architecture (EA) diagram is used to display the structure and operations of an organization. It is used to analyze and document an organization and its business functions, along with the applications and systems on which they are implemented. The aim of an enterprise architecture diagram is to determine how an organization can effectively achieve its current and future objectives. The Enterprise Architecture often uses diagrams to support the decision-making process. ConceptDraw DIAGRAM allows you to design Enterprise Architecture diagrams of any complexity.How to Draw ER Diagrams
An Entity Relationship (ER) Diagram is a type of flowchart that illustrates the logical structure of databases, how the different entities, such as people, objects or concepts relate to each other within a given system. How to draw ER Diagrams fast and easy? ConceptDraw DIAGRAM diagramming and vector drawing software enhanced with Entity-Relationship Diagram (ERD) solution from Software Development area of ConceptDraw Solution Park offers you the powerful abilities of designing the ER Diagrams and ERD drawings without efforts. This solution includes a lot of predesigned icons advocated by popular Chen's and Crow’s Foot notations, which can be used when describing an enterprise database and depicting it by abstract way. Simply drag the required objects to ConceptDraw document, connect them in a desired way and make style settings. But the easiest and fastest way of drawing ERDs is to make them on the base of ready-to-use Chen ERD and Crow's Foot ERD templates, which are both represented at ConceptDraw STORE.Entity Relationship Diagram Examples
Creation of Entity-Relationship (ER) model is a visual representation the structure of a business database, where data equates to entities or objects, which are linked by defined relationships expressing dependencies and requirements. By the nature, the ER model is an abstract visualization, a first step in design process towards creating a logical and functional database. ConceptDraw DIAGRAM professional software gives the ability to effectively describe a database using the Entity-Relationship model. Included to ConceptDraw Solution Park, the Entity-Relationship Diagram (ERD) solution contains the set of predesigned vector icons advocated by Chen's and Crow’s Foot notations that both can be used for data modeling and describing a database. Entity-Relationship Diagram (ERD) solution includes also helpful templates and incredibly large collection of varied Entity Relationship Diagram examples and samples offered at ConceptDraw STORE. Each of them can be used to develop your own model of a database of arbitrary complexity.
HelpDesk
How to Draw a Pyramid Diagram
Pyramid diagram (triangle diagram) is used to represent data, which have hierarchy and basics. Due to the triangular form of the diagram, each pyramid section has a different width. The width of the segment shows the level of its hierarchy. Typically, the top of the pyramid is the data that are more important than the base data. A pyramid scheme can be used to show proportional and hierarchical relationships between some logically related items, such as departments within an organization, or successive elements of any process. This type of diagram is often used in marketing to display hierarchically related data, but it can be used in a variety of situations. ConceptDraw DIAGRAM allows you to make a pyramid diagram, quickly and easily using special libraries.HelpDesk
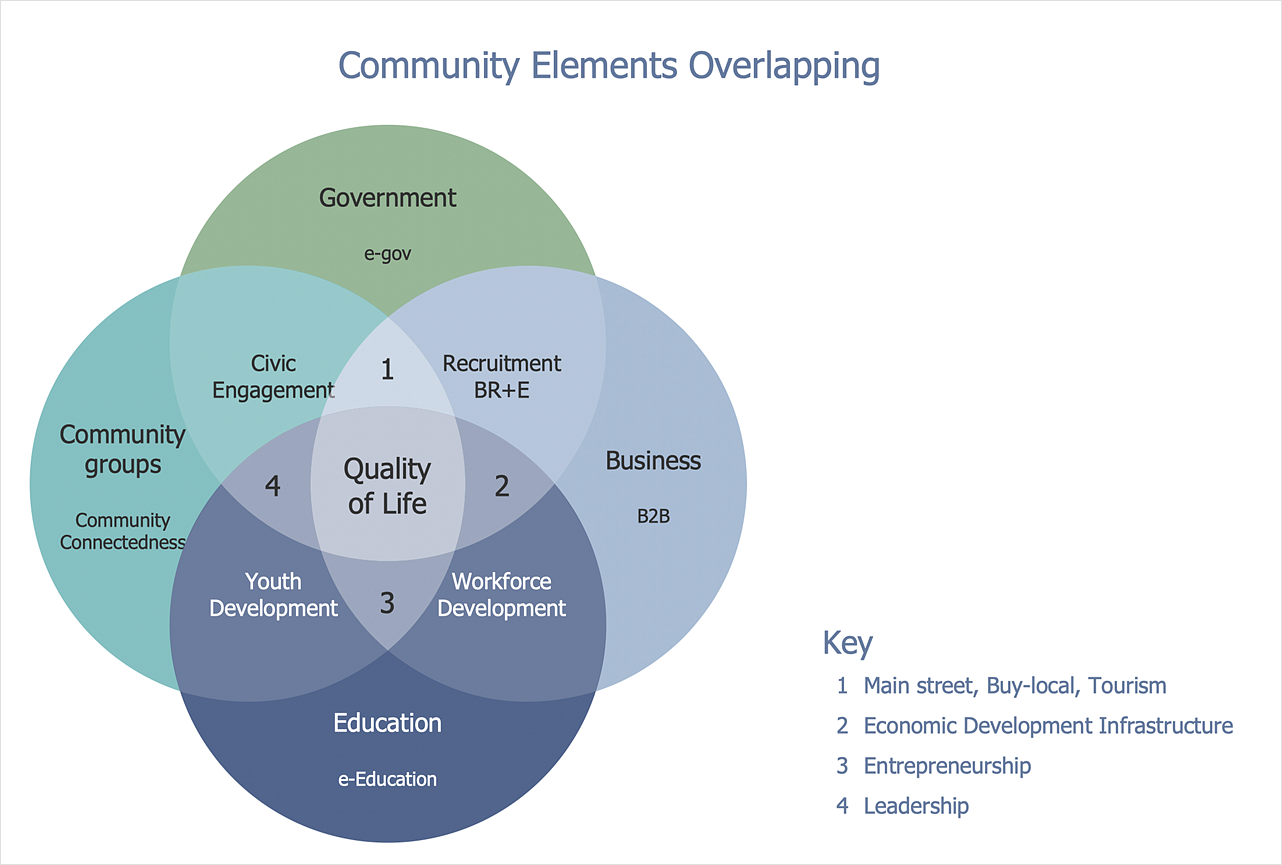
How to Create a Venn Diagram
Venn diagrams were invented by John Venn as a method of depicting relationships between different components. A Venn diagram consists of two or more circles. Each circle represents a specific group or set. The entities which are depicted by circles generally have some common characteristics. A Venn Diagram shows all the possible logical relations between these entities. Any properties that belong to more than one set should be indicated in the sections where the circles overlap. A Venn Diagram can be useful to visually summarize the status and future viability of a project. ConceptDraw DIAGRAM allows you to make Venn diagrams using the Venn Diagrams solution.How To Create Onion Diagram
An onion diagram is a kind of chart that shows the dependencies among parts of an organization or process. The chart displays items in concentric circles, where the items in each ring depend on the items in the smaller rings. The Onion Diagram is able to show layers of a complete system in a few circles. But how to create Onion Diagram? Now, it's very easy thanks to the ConceptDraw DIAGRAM diagramming and vector drawing software extended with Stakeholder Onion Diagrams Solution from the Management Area of ConceptDraw Solution Park.- Er Diagram Maker Project Ppt
- Draw An Er Diagram Using Word
- Entity Relationship Diagram Software | What's the best ERD tool for ...
- Entity Relationship Diagram Software for Mac | Drawing ER ...
- Basic Flowchart Symbols and Meaning | Data Flow Diagrams ...
- ConceptDraw PRO ER Diagram Tool | Entity Relationship Diagram ...
- Chemical Engineering Process Flow Diagram Software Free
- Draw Fishbone Diagram on MAC Software | The Best Mac Software ...
- ER Diagram Tools For Mac Logical Model
- Entity Relationship Diagram Software for Mac | Entity-Relationship ...


