HelpDesk
How to Shift Dates in ConceptDraw PROJECT
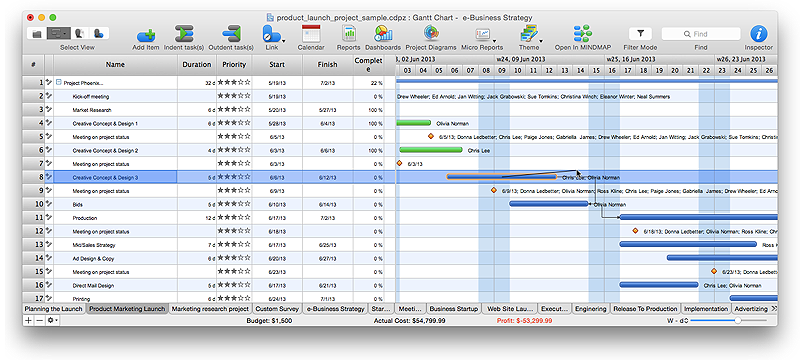
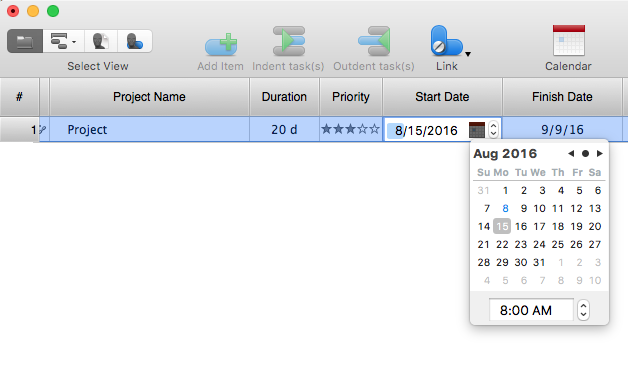
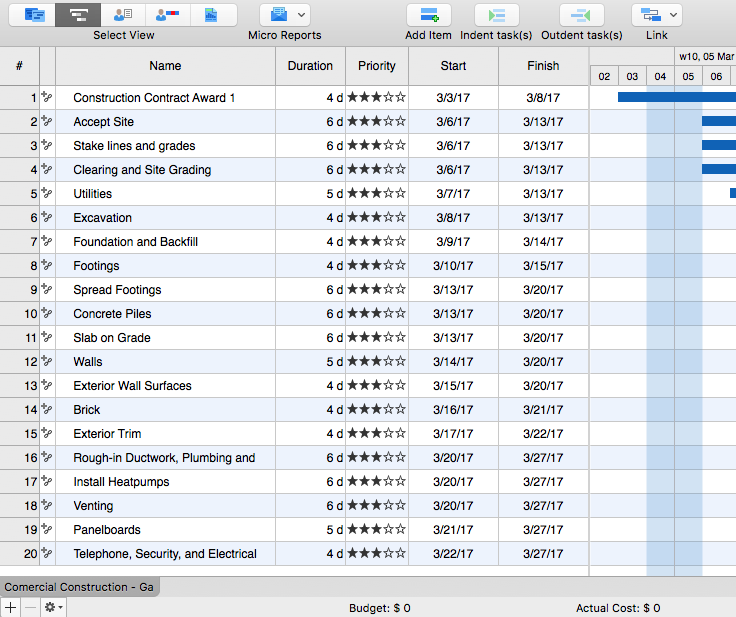
A way to shift all dates in a project a specified period, so you can use old project schedules as a template for new schedulesHelpDesk
How to Operate with Project Time Frames in ConceptDraw PROJECT
ConceptDraw PROJECT applies an advanced scheduling facilities to enable you arrange your project's tasks with existing human and material resources. Comprehension of project scheduling principle allows you to plan the project the best way to execute it. Sometimes user is wondering why the task is moved to a different time than he supposed. Or he may be confused when a task's tardiness provoke the unwanted shift of other tasks. This article describes how do changes to the Start/Finish dates, or the Duration of the task affect the project schedule, created in ConceptDraw PROJECT.LLNL Flow Charts
These flow charts help scientists analysts and other decision makers to visualize the complex interrelationships involved in managing our nation x2019.HelpDesk
How to Import Project Data From MS Excel File
You can import information into the project from MS Excel workbook using the entered fields - fields in which you can enter or edit information as opposed to calculated fields.HelpDesk
How to Draw the Different Types of Pie Charts
Using the Pie Chart, you can visually estimate the relative contribution that different data categories contribute to a whole value. The pie chart displays the statistics in a visual format. The main use of pie charts to show comparisons. The larger piece of the pie, the more the value of this value compared to the rest. Various applications of pie charts can be found in business and education. For business, pie charts can be used to compare the success or failure of the goods or services. They may also be used to display the business market share.- Blank Calendar Template | How to Shift Dates in ConceptDraw ...
- Project planning process - Flowchart | How to Create Multple ...
- How to Shift Dates in ConceptDraw PROJECT | Project Timeline ...
- Project planning process - Flowchart | Daily Schedule Chart | Critical ...
- How to Shift Dates in ConceptDraw PROJECT | Project Timeline ...
- How to Shift Dates in ConceptDraw PROJECT | Data Flow Diagram ...
- How to Shift Dates in ConceptDraw PROJECT | PERT chart ...
- How to Shift Dates in ConceptDraw PROJECT | How to Track Your ...
- How to Shift Dates in ConceptDraw PROJECT | How to Create ...
- Project Management Sample Schedule
- Competitor Analysis | Process Flowchart | Pie Digram Of Comany ...
- Fishbone Schedule
- Project Timeline | How to Shift Dates in ConceptDraw PROJECT ...
- Gantt Chart Example On Shift
- How to Shift Dates in ConceptDraw PROJECT | How to Track Your ...
- How to Shift Dates in ConceptDraw PROJECT | How to Operate with ...
- Timeline Diagrams | Daily Schedule Chart | Timeline Diagrams ...
- Working Plan Schedule And Flowchart
- How to Shift Dates in ConceptDraw PROJECT | Ganttproject


.jpg)

