Design Pictorial Infographics. Design Infographics

The vector stencils library "Shopping pictograms" contains 20 shopping symbols.
Use it to draw your infographics.
The example "Design elements - Shopping pictograms" was created using the ConceptDraw PRO diagramming and vector drawing software extended with the Pictorial Infographic solution from the area "What is infographics" in ConceptDraw Solution Park.
Use it to draw your infographics.
The example "Design elements - Shopping pictograms" was created using the ConceptDraw PRO diagramming and vector drawing software extended with the Pictorial Infographic solution from the area "What is infographics" in ConceptDraw Solution Park.
Pictograms
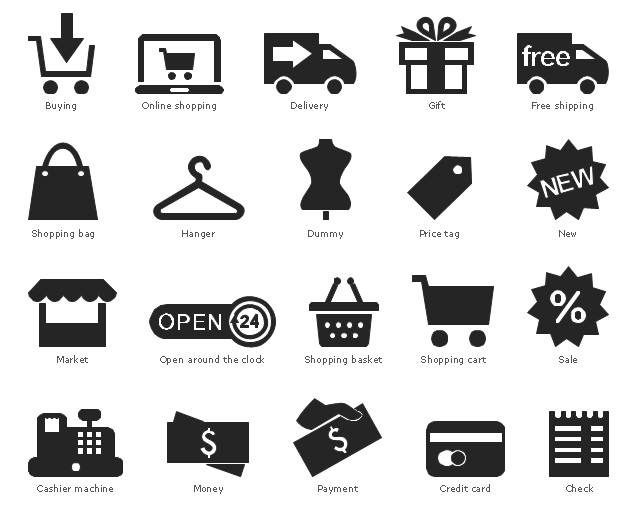
The vector stencils library "Shopping pictograms" contains 20 icons of shop, store and trade symbols. Use it to draw your pictorial infograms. The example "Shopping pictograms - Vector stencils library" was created using the ConceptDraw PRO diagramming and vector drawing software extended with the Pictorial infographics solution from the area "What is infographics" in ConceptDraw Solution Park.
Sale

New

Shopping basket

Shopping cart

Market

Cashier machine

Check

Shopping bag

Price tag

Buying

Dummy

Hanger

Delivery

Free shipping

Gift

Money

Payment

Credit card

Online shopping

Open around the clock

Infographic Software

Infographic Maker

 Fishbone Diagrams
The Fishbone Diagrams solution extends ConceptDraw PRO v10 software with the ability to easily draw the Fishbone Diagrams (Ishikawa Diagrams) to clearly see the cause and effect analysis and also problem solving. The vector graphic diagrams produced using this solution can be used in whitepapers, presentations, datasheets, posters, and published technical material.
 Fishbone Diagram
Fishbone Diagrams solution extends ConceptDraw PRO software with templates, samples and library of vector stencils for drawing the Ishikawa diagrams for cause and effect analysis.
Process Flowchart


The vector stencils library "Transport map" contains 96 pictograms for drawing transport maps.
Use it in your spatial infographics for visual representation of transport schemes and plans as metro maps in the ConceptDraw PRO diagramming and vector drawing software extended with the Spatial Infographics solution from the area "What is Infographics" of ConceptDraw Solution Park.
Use it in your spatial infographics for visual representation of transport schemes and plans as metro maps in the ConceptDraw PRO diagramming and vector drawing software extended with the Spatial Infographics solution from the area "What is Infographics" of ConceptDraw Solution Park.
Train Railway

Bus Stop

Tramlink

Marina/Ferry Dock

Information Center

Information Center

Airport

Airport

Underground/Subway/Metro

Underground/Subway/Metro

National Rail Train Station

Taxi

Taxi

Parking

Parking

Parking

Parking

Bicycle Parking

Bicycle Parking

Fuel/Gas/Petrol

Fuel/Gas/Petrol

Police

Police

Hospital

Hospital

Wheelchair Access

Wheelchair Access

First Aid

First Aid

Telephone

Telephone

Post Office

Post Office

Landmarks and Museums

Landmarks and Museums

University

University

Shopping/Supermarket

Shopping/Supermarket

Cafe

Cafe

Food and Drinks

Food and Drinks

Man

Woman

Restrooms/Toilets

Restrooms/Toilets

Park

Park

Zoo

Zoo

Hotel

Hotel

Camping

Camping

City

Skyscraper

Building

Ocean

Straight River

Flexible River

Bridge

North Arrow
Viewpoint

Scale

Road line

Road rounded line

Road corner

Road curve 1

Road curve 2

Crossroads

Roundabout

Cloverleaf interchange

Roadway break

Railway line

Railway curve

Railway fork

Standard line with standard station - basic road

Thick line with standard station - basic road

Standard line with rectangular station - basic road

Thick line with rectangular station - basic road

Standard line with standard station - double road

Thick line with standard station - double road

Standard line with rectangular station - double road

Thick line with rectangular station - double road

Standard line with standard station - dotted road

Thick line with standard station - dotted road

Standard line with rectangular station - dotted road

Thick line with rectangular station - dotted road

Interchange Station Vertical

Interchange Station Horizontal

Transfer Station 1

Transfer Station 2

Transfer Station 3

Line Notation

Street direction

 Entity-Relationship Diagram (ERD)
Entity-Relationship Diagram (ERD) solution extends ConceptDraw PRO software with templates, samples and libraries of vector stencils from drawing the ER-diagrams by Chen's and crow’s foot notations.
The vector stencils library "Landmarks" contains 34 landmark symbols.
Use it to mark maps for spatial infographics in the ConceptDraw PRO diagramming and vector drawing software extended with the Spatial Infographics solution from the area "What is Infographics" of ConceptDraw Solution Park.
Use it to mark maps for spatial infographics in the ConceptDraw PRO diagramming and vector drawing software extended with the Spatial Infographics solution from the area "What is Infographics" of ConceptDraw Solution Park.
Airport

Skyscraper

City

Building 1

Building 2

House 1

House 2

Factory

Petrol Station
Fire Station

Hospital

Town Hall

Cathedral

Shopping Centre

Convenience Store

Park

Traffic Light
Bus 1

Bus 2

Tram 1

Tram 2

Train

Train/Tram

Car 1

Car 2

Car 3

Bicycle

Ferry/Boat

Airplane

Funicular

Ropeway/Cableway

River

Lake

Stadium
How to Draw Pictorial Chart. How to Use Infograms

- Man Pushing Shopping Cart Vector Png
- Basket Shop Png
- Shopping Cart Png
- Design elements - Shopping pictograms | Internet Marketing ...
- Shopping pictograms - Vector stencils library | Near field ...
- Filling Station Png
- Shopping pictograms - Vector stencils library | Design elements ...
- Market Shop Cart Icon Png
- Shopping Png
- Shopping Bag Logo Png
- Shopping Cart Line Drawing Png
- Shopping Cart Vector Icon Png
- Person Infographic Icon Png
- ConceptDraw Solution Park | Shopping Online | How to draw Metro ...
- Best Tool for Infographic Construction | North Sign Png Minimalist
- Shopping pictograms - Vector stencils library | Shopping pictograms ...
- Travel Infographics | Best Tool for Infographic Construction ...
- Design Pictorial Infographics . Design Infographics | Car Minimalist Png
- Cart With Person Png