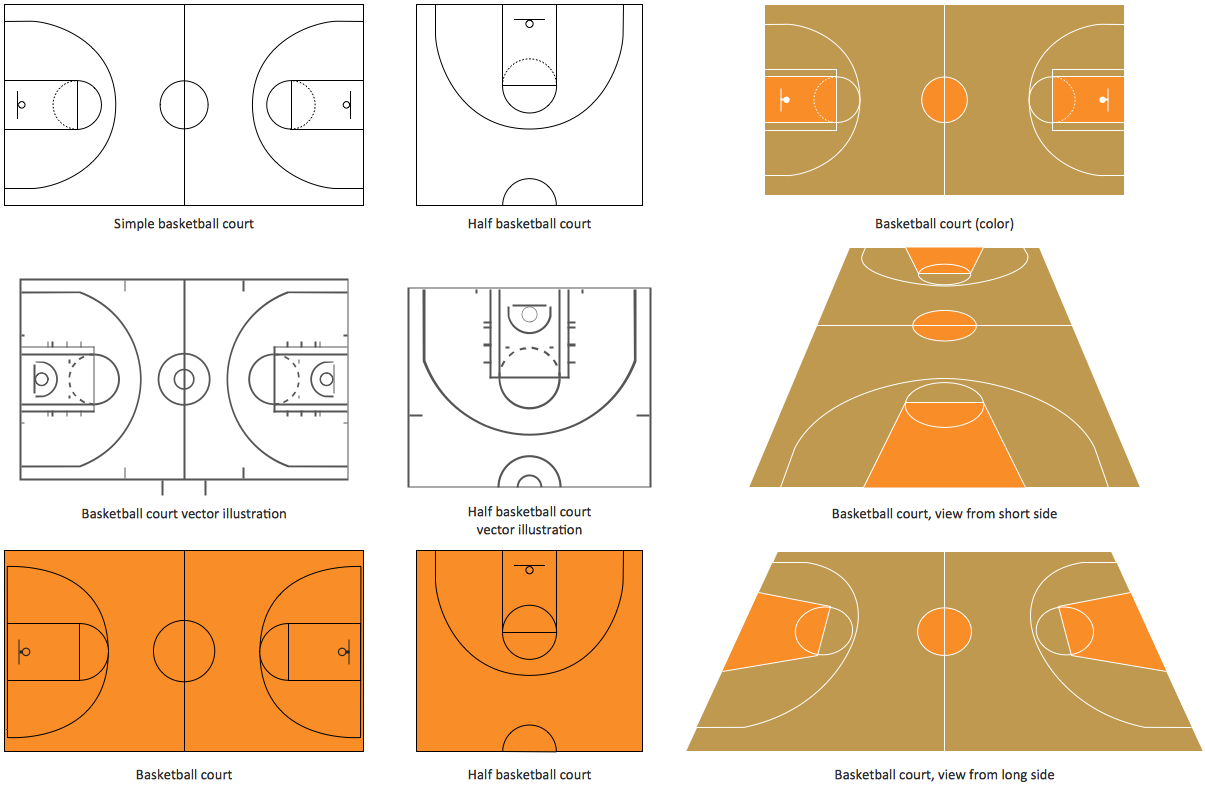
Basketball Court Diagram and Basketball Positions
ConceptDraw PRO software extended with the Basketball solution from the Sport area of ConceptDraw Solution Park provides libraries, templates and samples allowing basketball specialists and fans to draw the professional looking diagrams and schemas of any complexity in a few minutes. It’s very convenient way to explain the different basketball tactics, positions and rules using the visual illustrations.
 Basketball
The Basketball Solution extends ConceptDraw PRO v9.5 (or later) software with samples, templates, and libraries of vector objects for drawing basketball diagrams, plays schemas, and illustrations. It can be used to make professional looking documents, pre
 Sport Field Plans
Construction of sport complex, playgrounds, sport school, sport grounds and fields assumes creation clear plans, layouts, or sketches. In many cases you need represent on the plan multitude of details, including dimensions, placement of bleachers, lighting, considering important sport aspects and other special things.
 Seating Plans
The correct and convenient arrangement of tables, chairs and other furniture in auditoriums, theaters, cinemas, banquet halls, restaurants, and many other premises and buildings which accommodate large quantity of people, has great value and in many cases requires drawing detailed plans. The Seating Plans Solution is specially developed for their easy construction.
 ConceptDraw Solution Park
ConceptDraw Solution Park collects graphic extensions, examples and learning materials
 Organizational Charts
Organizational Charts solution extends ConceptDraw PRO software with samples, templates and library of vector stencils for drawing the org charts.
 Area Charts
Area Charts are used to display the cumulative totals over time using numbers or percentages; or to show trends over time among related attributes. The Area Chart is effective when comparing two or more quantities. Each series of data is typically represented with a different color, the use of color transparency in an object’s transparency shows overlapped areas and smaller areas hidden behind larger areas.
 Bubble Diagrams
Bubble diagrams have enjoyed great success in software engineering, architecture, economics, medicine, landscape design, scientific and educational process, for ideas organization during brainstorming, for making business illustrations, presentations, planning, design, and strategy development. They are popular because of their simplicity and their powerful visual communication attributes.
 25 Typical Orgcharts
The 25 Typical Orgcharts solution contains powerful organizational structure and organizational management drawing tools, a variety of professionally designed organization chart and matrix organization structure samples, 25 templates based on various orga
 Cross-Functional Flowcharts
Cross-functional flowcharts are powerful and useful tool for visualizing and analyzing complex business processes which requires involvement of multiple people, teams or even departments. They let clearly represent a sequence of the process steps, the order of operations, relationships between processes and responsible functional units (such as departments or positions).
 Basic Area Charts
This solution extends the capabilities of ConceptDraw PRO v10.3.0 (or later) with templates, samples and a library of vector stencils for drawing Area Charts (area graphs) that visualize changes in values by filling in the area beneath the line connecting data points.
 Food Court
Use the Food Court solution to create food art. Pictures of food can be designed using libraries of food images, fruit art and pictures of vegetables.
 Flowcharts
The Flowcharts Solution for ConceptDraw PRO v10 is a comprehensive set of examples and samples in several different color themes for professionals that need to graphically represent a process. Solution value is added by basic flow chart template and shapes' library of Flowchart notation. ConceptDraw PRO flow chart creator lets one depict a processes of any complexity and length, as well design of the flowchart either vertically or horizontally.
 Composition Dashboard
Composition dashboard solution extends ConceptDraw PRO software with templates, samples and vector stencils library with charts and indicators for drawing visual dashboards showing data composition.
- Basketball Court Diagram and Basketball Positions | Sport Field ...
- Draw A Basketball Court And Show Only The Defence Position Of ...
- Basketball Court Diagram and Basketball Positions | Basketball ...
- How to Make a Basketball Court Diagram | Design elements ...
- Basketball Court Diagram and Basketball Positions | Basketball ...
- Basketball | Basketball Field in the Vector | Flow Chart for Olympic ...
- Basketball Court Diagram and Basketball Positions | Basketball ...
- Basketball Illustrations | Basketball Court Dimensions | Basketball ...
- Soccer (Football) Formation | Basketball Court Diagram and ...
- Basketball court | Interior Design Sport Fields - Design Elements ...
- Ice Hockey Rink Dimensions | Basketball Court Dimensions ...
- Flow Chart Symbols | Technical Flow Chart Example | Design ...
- Basketball Court Dimensions | Basketball Court Diagram and ...
- Basketball Court Dimensions | Offensive Strategy – Spread Offense ...
- Soccer (Football) Diagram Software | Basketball Court Dimensions ...
- Basketball Court Dimensions | Interactive Venn Diagram | Venn ...
- Hockey Court Diagram
- Basketball courts - Vector stencils library | Basketball courts - Vector ...
- Basketball Illustrations | Basketball Plays Software | Basketball Court ...
- Basketball Court Diagram and Basketball Positions | Soccer ...
