Local area network (LAN). Computer and Network Examples
Local Area Network (LAN) is a network which consists of computers and peripheral devices connected each other and to the local domain server, and covers a little territory or small number of buildings, such as home, school, laboratory, office, etc. LAN serves for few hundreds of users. It includes many cables and wires, and demands to design previously a Network diagram. All local area network devices can use the shared printers and disk storage. ConceptDraw DIAGRAM is a perfect network diagramming software with examples of LAN Diagrams, templates and predesigned vector objects. ConceptDraw DIAGRAM is the ideal choice for network engineers and network designers who need to draw fast and easy Local Area Network Diagrams, for IT specialists, developers and other IT professionals which need to visualize the communication schemes of LAN and visually document the LAN's physical structure and arrangement in houses, offices and other buildings. Ready-to-use vector objects from Computer Network Diagrams solution will help you design LAN diagrams in minutes.
Flowchart Example: Flow Chart of Marketing Analysis
An example flowchart of marketing analysis shows main steps you have to challenge writing a marketing analysis.Sentence Diagrammer
Sentence a grammatical unit of several words, and provides a narrative, question, comment, etc. It begins with a capital letter and ends with proper punctuation. Sentence diagramming allows you to visually present the sentence part function, which helps you build right sentences. Language Learning solution offers the Sentence Diagrams Library with set of vector stencils for drawing various Sentence Diagrams, for visualizing grammatical structures that will assist you in language learning and construction of grammatically correct sentences. ConceptDraw DIAGRAM diagramming software extended with Language Learning solution from the Science and Education area provides the powerful sentence diagraming tools.Cross-Functional Flowchart
Use of Cross-Functional Flowchart is a clear way of showing each team member’s responsibilities and how processes get shared or transferred between different responsible people, teams and departments. Use the best flowchart maker ConceptDraw DIAGRAM with a range of standardized cross-functional flowchart symbols to create the Cross-Functional Flowcharts simply and to visualize the relationship between a business process and the functional units responsible for that process. To draw the most quickly Cross-Functional Flowcharts, Cross Functional Process Maps, or Cross Functional Process Flow Diagrams, start with a Cross-functional flowchart samples and templates from ConceptDraw Solution Park. The ConceptDraw Arrows10 and RapidDraw technologies will be also useful for you in drawing. ConceptDraw DIAGRAM supports designing both types - horizontal and vertical Cross-functional flowcharts. A vertical layout makes the accents mainly on the functional units while a horizontal layout - on the process. If you need a Visio alternative in Mac OS X, try ConceptDraw DIAGRAM. Its interface is very intuitive and it’s actually much easier to use than Visio, yet somehow it’s just as powerful if not more so. ConceptDraw DIAGRAM performs professional quality work and seamless Visio interaction.
Matrix Organization Structure
Matrix organizational structure is one of the main forms of structures which is actively used by organizations to carry forth the functions of a company visually and effectively. Now we have ConceptDraw DIAGRAM diagramming and vector drawing software extended with 25 Typical Orgcharts solution from the Management area of ConceptDraw Solution Park which will help easy represent matrix organizational structure of any degree of complexity.Relations Diagram
The Relations Diagram is used to identify how the factors influence each other, to determine what factors are causes and what are effects. The factors mostly influencing are called “drivers”, the primarily affected factors are “indicators”. The problem solving is focused on the change of "drivers" factors by applying the corrective actions. The "indicators" factors help establish the Key Performance Indicators (KPIs) to monitor the changes and also define the effectiveness of the corrective actions in resolving a problem. ConceptDraw MINDMAP software ideally suits for designing Relations Diagrams. The easiest way to create the MINDMAP Relations Diagram, is to use the included Relations Diagram input template. Open it in ConceptDraw MINDMAP application from the Input tab and hold a new brainstorming session, identify the central issue and the contributing factors to this issue. Click the Finish Brainstorm button to generate a Mind Map and begin the further work with it, or select Relations Diagram item from the Output tab to automatically draw it in ConceptDraw DIAGRAM application.Affinity Diagram
The Affinity Diagram, also known as a KJ diagram, is a business tool invented for organization the large quantity of ideas and data. It is a part of Seven Management and Planning Tools, it is usually used right after brainstorming to sort large numbers of ideas into the corresponding groups. The Affinity Diagram helps to represent in a better way the structure of large and complex factors which influence on a problem, divides these factors into the smaller and simpler structures, and helps team members to see the patterns and identify possible solutions to problems they have. The diagrams of this type don't show the causal relationships between the factors, but they are designed to prepare the data for holding further analysis of the cause-effect relationships. Another area of Affinity Diagram usage is contextual inquiry as a way to sort observations and notes from field interviews, support call logs, open-ended survey responses organizing, etc. ConceptDraw MINDMAP software offers you the tools for easy holding brainstorming, generation ideas and creation MINDMAP Affinity Diagram.Near-me area networks (NAN). Computer and Network Examples
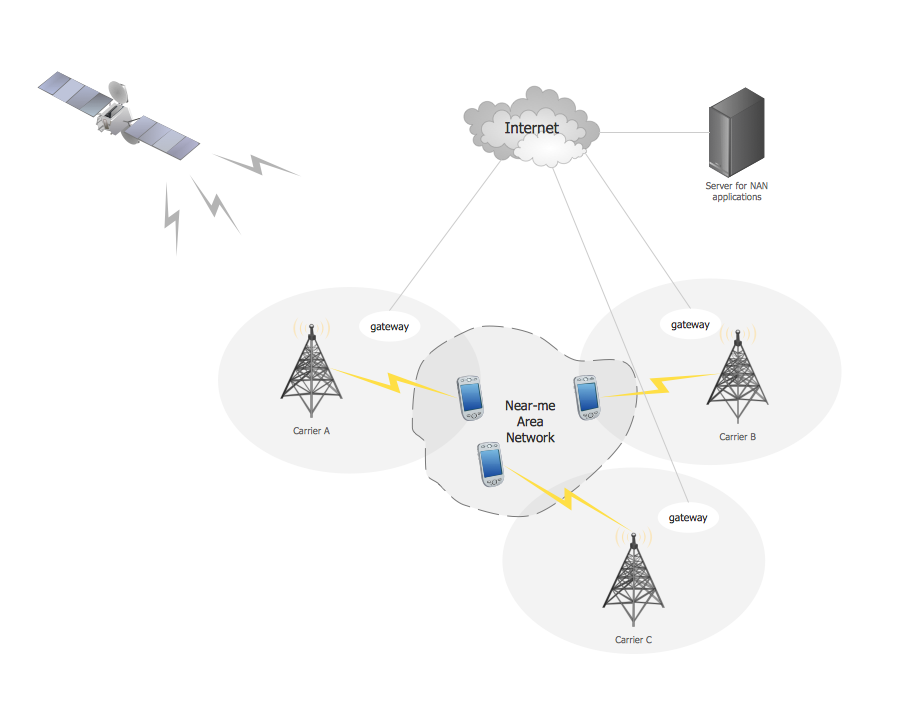
A Near-me area network (NAN) is a logical communication network. NAN focuses on the communication between wireless devices in the close proximity. All networks designed with ConceptDraw DIAGRAM are vector graphic documents and are available for reviewing, modifying, and converting to a variety of formats (image, HTML, PDF file, MS PowerPoint Presentation, Adobe Flash or MS Visio XML).
Introductory Guide to Rapid UML Solution
The ability to develop UML diagrams as quickly as the ideas come. The solution uses ConceptDraw RapidDraw techniques. The result is a vector graphic document.Star Network Topology
Star is a basic computer network topology in which all nodes (computers and peripheral devices) of the network are connected to the central hub or switch with a point-to-point connection, forming a physical network segment. Such network segment can function separately or as a part of complex network topology. The switch is a server, the peripherals are the clients. The large workload and functions of network management are entrusted on the central computer, all information exchange goes through it, so it must to be obligatory the most powerful. The star network topology is a simple topology for design and implementation. Its advantages are high performance, flexible administration capabilities, simplicity of adding additional nodes and search of faults, the fact that a failure of one workstation doesn't affect the work of entire network. But the failure of central hub will result the failure of whole network or network segment - it's the main disadvantage. Use the ConceptDraw DIAGRAM with Computer and Networks solution to designing Star Network Topology Diagrams fast and easy.
- Draw A Sketch Of System Development Cycle
- Active Directory Domain Services diagram | Organizational Structure ...
- Flow Diagram Of Ways To Solve Crime
- Design elements - TQM diagram | Design elements - HR workflow ...
- A Flow Diagram Of Crime Solution Processes
- Process Flowchart | Basic Flowchart Symbols and Meaning | Types ...
- Flowchart Components | Entity Relationship Diagram Symbols ...
- Entity Relationship Diagram Examples | Example of DFD for Online ...
- Functional Block Diagram | Context Diagram Template | Process ...
- Atmosphere air composition | Percentage Pie Chart . Pie Chart ...


