Healthy Foods
Use of various charts, diagrams and infographics is the most effective way of visual presenting information about healthy foods, healthy eating and healthy diet. ConceptDraw DIAGRAM diagramming and vector drawing software offers the Health Food solution from the Food and Beverage area of ConceptDraw Solution Park which is overfull of powerful drawing tools, libraries with ready-to-use vector objects and clipart, predesigned samples and examples which will help you easy design healthy foods illustrations.Food Recipes
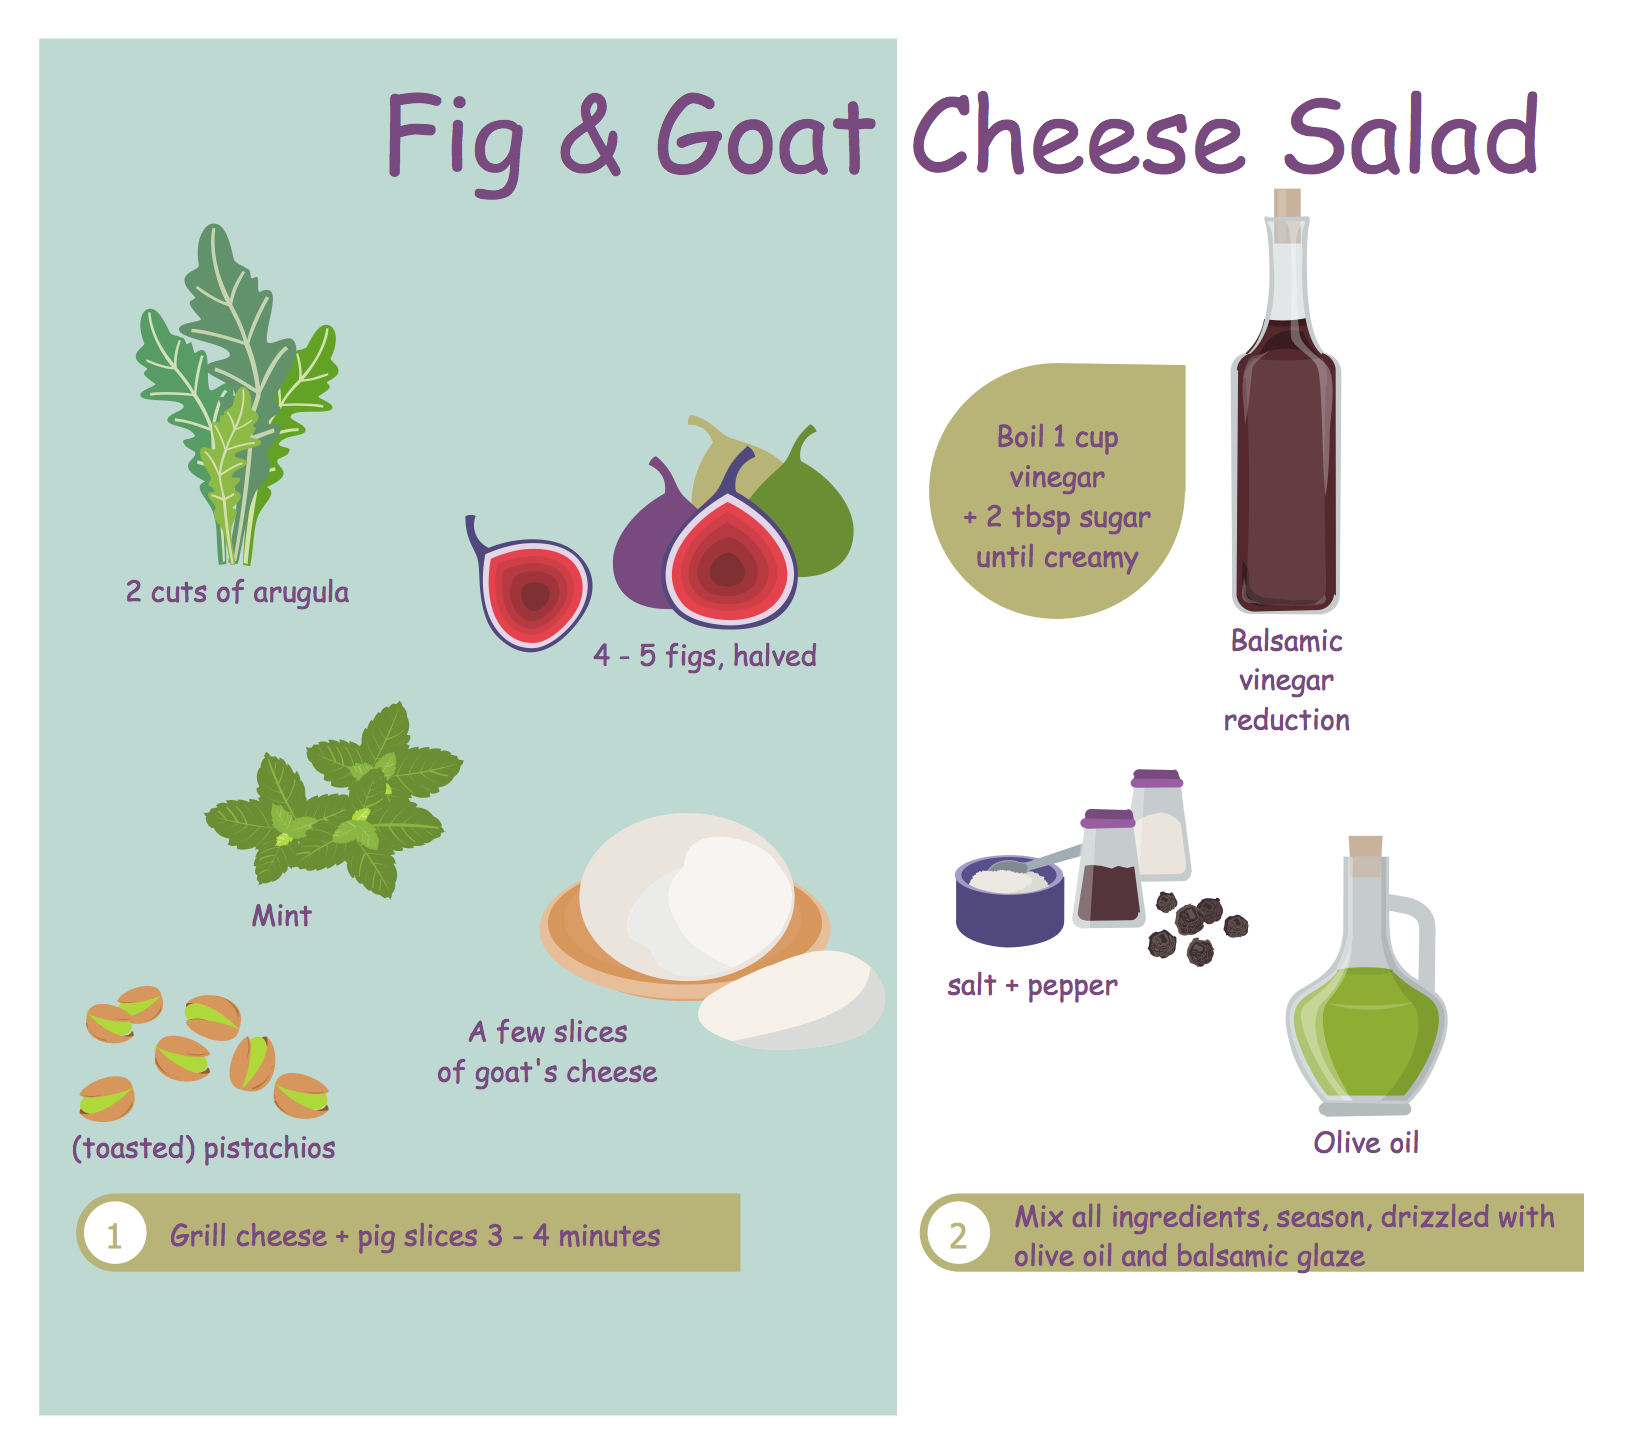
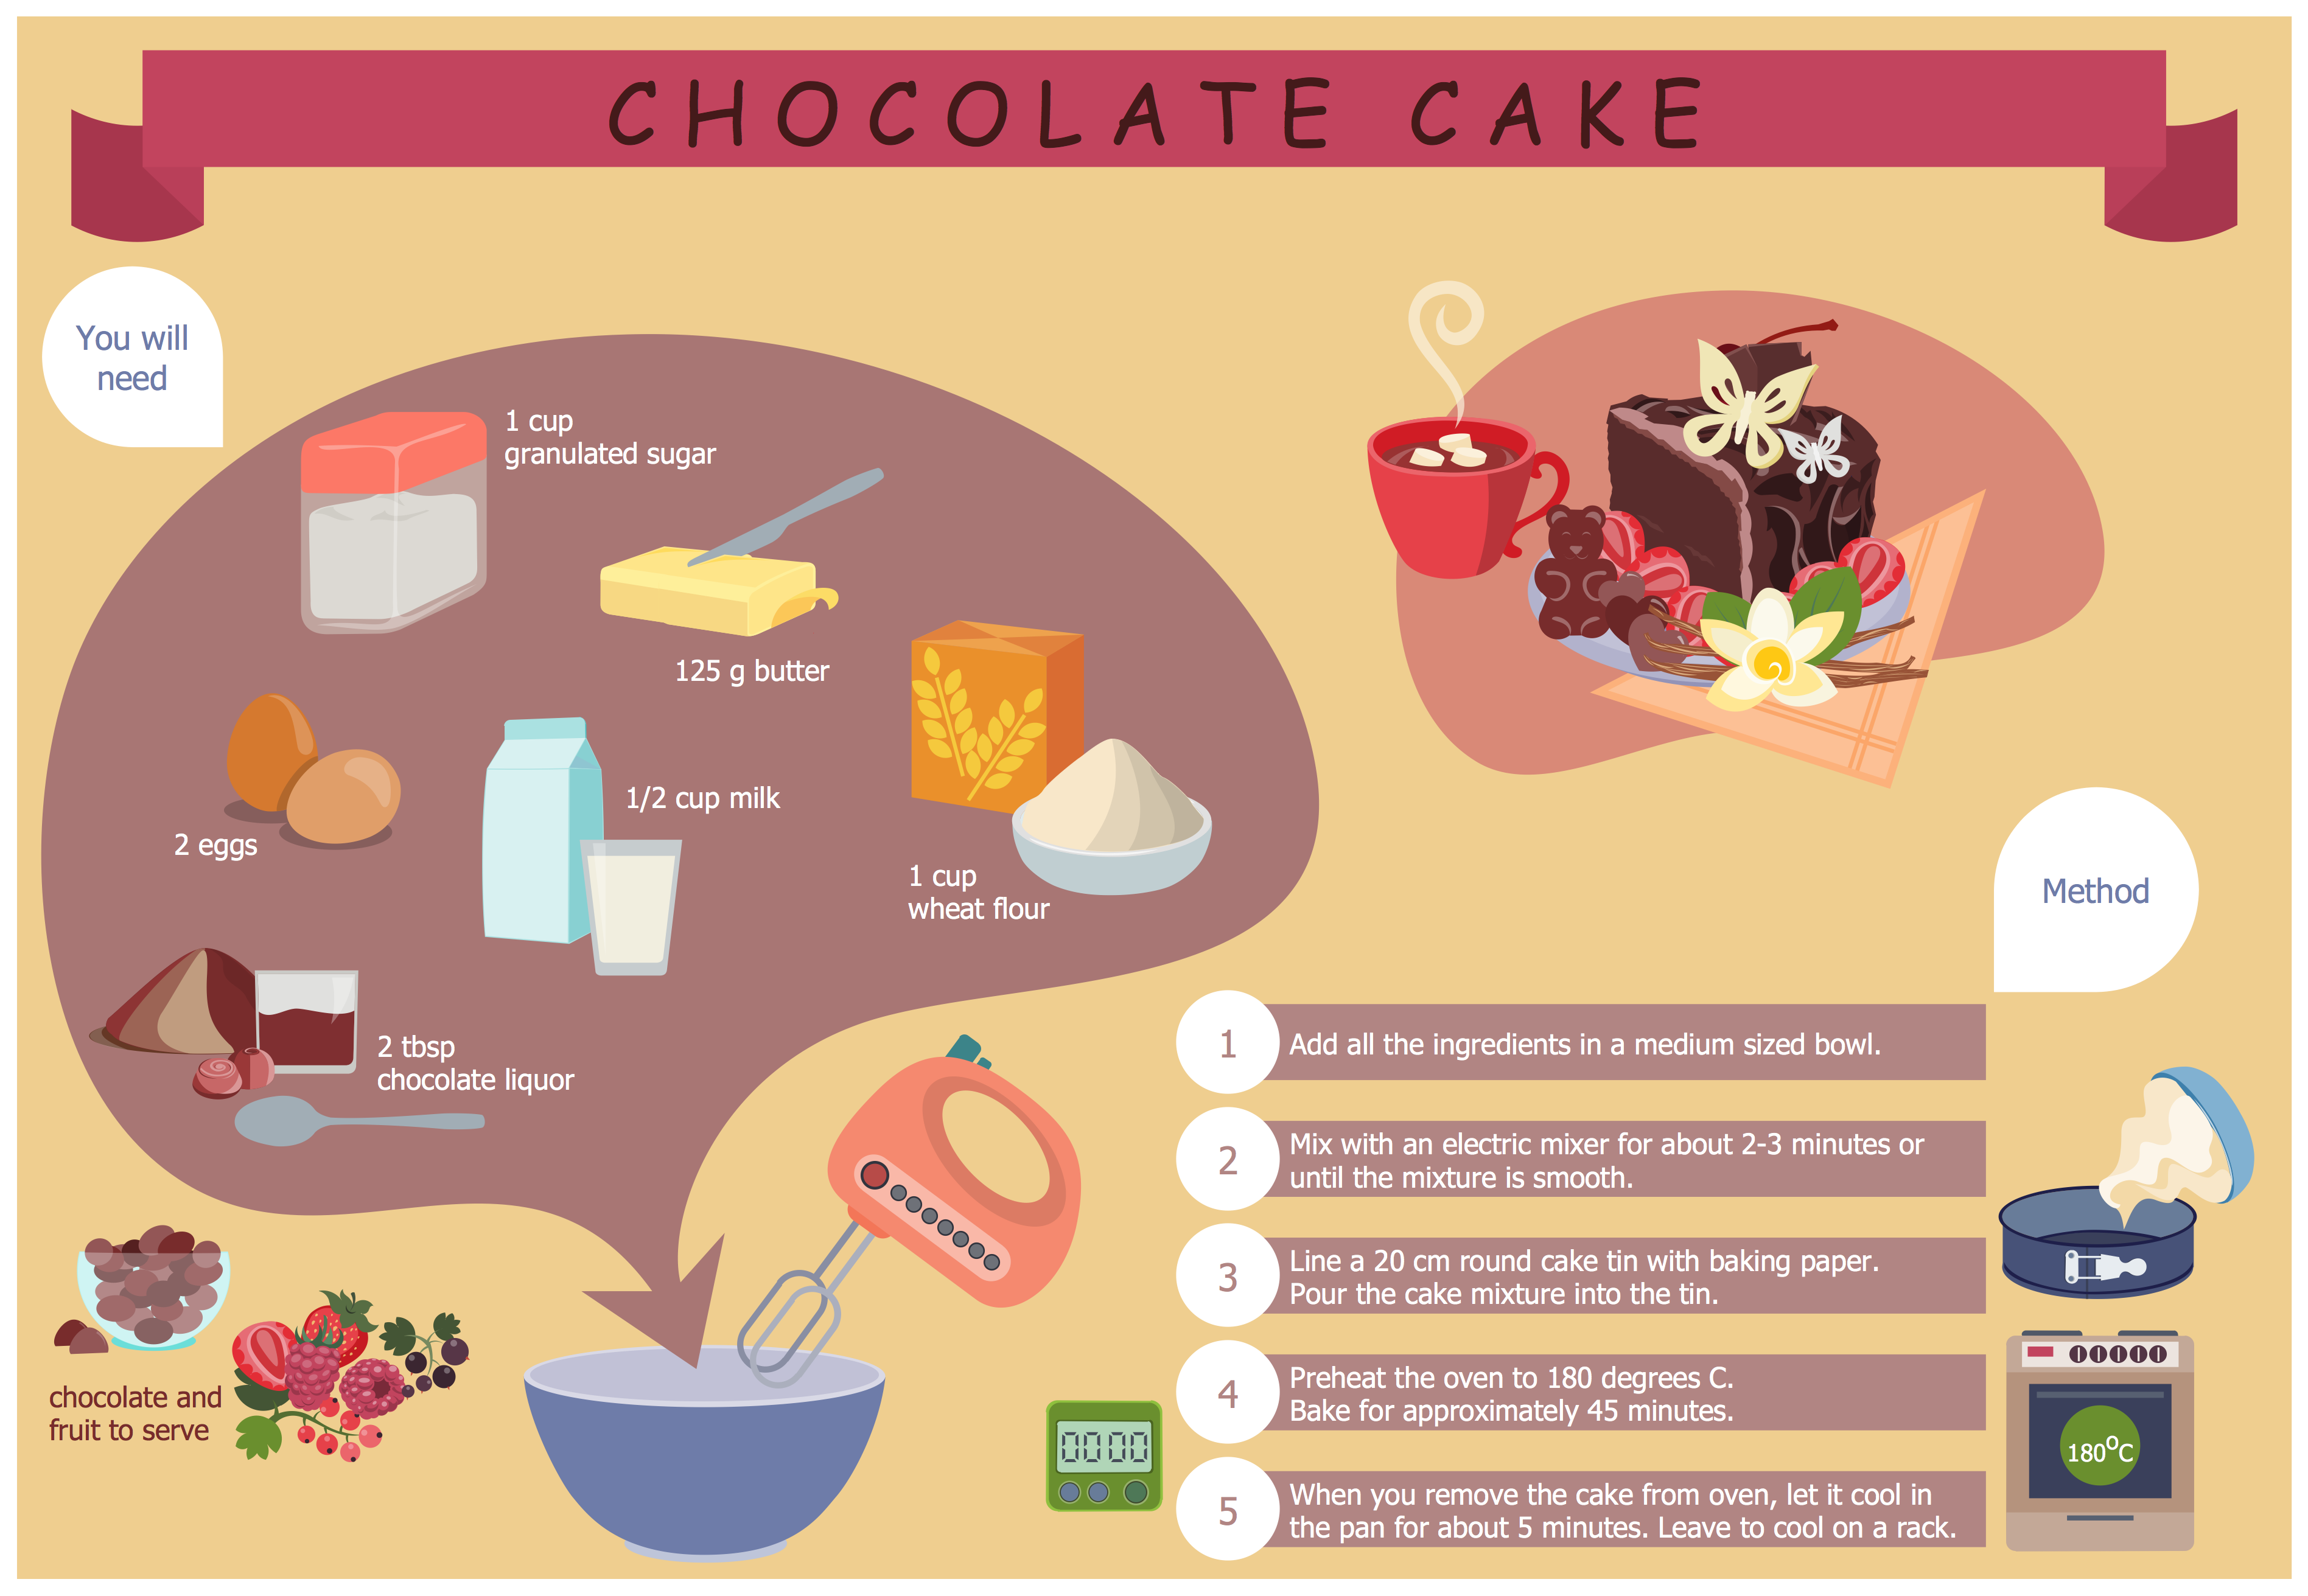
The food has great importance in human life, but it is very important that the food was tasty and salubrious. Preparing the food with help of different recipes from the fashion magazines, popular cookbooks, Internet cooking sites, we firstly pay attention to the recipe's design, how delicious and aesthetically the dish is presented on the picture. Use the ConceptDraw DIAGRAM diagramming and vector drawing software extended with Cooking Recipes solution from the Food and Beverage area of ConceptDraw Solution Park for easy design colorful and eye-catching food recipes illustrations.Easy Recipes
You want to decorate menu, design pictorial illustration for the cooking article in the fashionable magazine, create attractive posters for your cafe or restaurant, or develop beautiful advertising materials? In order to ideally cope with all these tasks, use the easy recipes design software - ConceptDraw DIAGRAM extended with Cooking Recipes solution from the Food and Beverage area of ConceptDraw Solution Park.Geo Map — United States of America Map
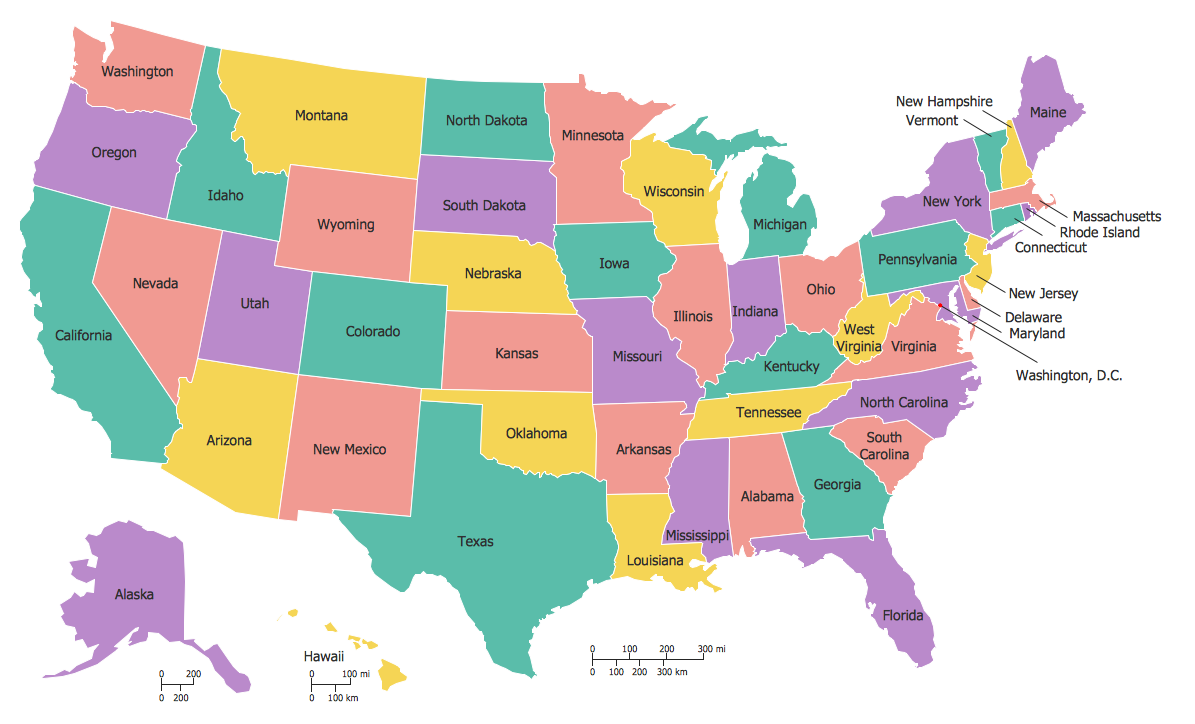
United States of America (USA) is a federal republic that includes 50 states and a federal district. It is the third largest country by population, fourth by the total area, and one of the most diverse in respect of nationalities and cultures. ConceptDraw DIAGRAM software extended with Continent Maps solution is ideal to draw professional looking Geological map of United States of America, USA map with states, the separate maps of different states of America, thematic maps, geospatial infographics, and varied vector illustrations for your business documents, presentations and websites. Use the pre-designed vector geo map shapes offered by numerous libraries, in particular by the United States of America library that contains 53 United States of America map contours. Each map is scaled, with the option to add the further levels of detail, thus the county borders, their names, capitals, and major cities can be instantly shown or hidden using the Action menu for each state map. ConceptDraw DIAGRAM software gives you a full control over the map size, shading, color fills and alignment.Critical Path Method in ConceptDraw PROJECT
The Critical Path Method (CPM) is an algorithm for scheduling a set of project activities. It is an important tool for effective project management. ConceptDraw PROJECT implements this method to provide the user with a wide set of project management tools.- Food Court | Business Process Mapping | Business Process ...
- Basic Flowchart Symbols and Meaning | Components of ER ...
- Health Food | Design elements - Qualifying | Divided Bar Diagrams ...
- Venn Diagram Examples for Problem Solving. Venn Diagram as a ...
- How to Create Infographics that Help People Eat Healthy | Food ...
- Food Security Diagrams
- SWOT Analysis | SWOT and TOWS Matrix Diagrams | How to Create ...
- Food Court | Pictures of Vegetables | Fruit Art | Diagrams Of Fruit ...
- Food security assessment - Flowchart | Flowcharts | Contoh ...
- Food Court | Pictures of Vegetables | Cooking Recipes | Diagrams ...
- Pyramid Diagram With Measurement
- Flow Charts Of Food Sampling
- Healthy Diet Plan | Flowchart Examples and Templates | Healthy ...
- Bar Graphs | Bar Diagrams for Problem Solving. Create space ...
- Flowcharts Of Food Sampling
- Cisco Network Diagrams | ConceptDraw Solution Park | Food Court ...
- How to Create a Data Flow Diagram using ConceptDraw PRO ...
- Catabolism schematic - Biochemical diagram | Citric acid cycle (TCA ...
- Ice Hockey Diagram – Deke Technique | Collaboration in a Project ...
- Fishbone Diagram | Fishbone Diagrams | Cause and Effect ...


