HelpDesk
How to Set Line Jumps for Smart Connectors in ConceptDraw DIAGRAM
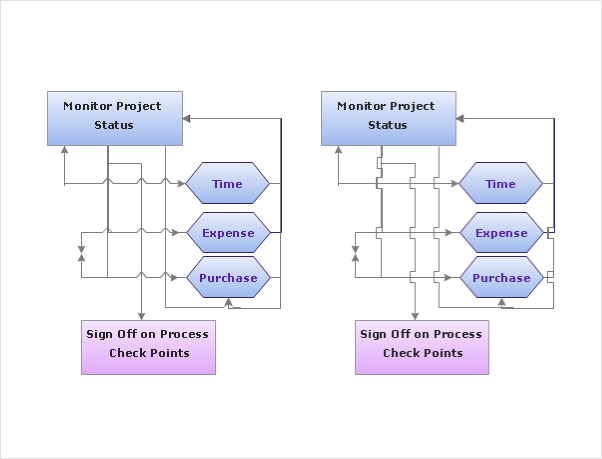
Connecting objects in ConceptDraw DIAGRAM is an easy task. You can use Chain, or Tree connection mode for automatic connection of multiple objects. Besides the automatic connection modes, ConceptDraw DIAGRAM offers few options to connect objects manually: Direct, Arc, Bezier, Smart, Curve and Round Connectors. You can make them square, arched or angled and also set vertical or horizontal orientation Thus, you can control how the jumps and orientation occurs on smart connectors. When two smart connectors cross each other you can control how the two intersecting lines look.Bubble diagrams in Landscape Design with ConceptDraw DIAGRAM
Bubble Diagrams are the charts with a bubble presentation of data with obligatory consideration of bubble's sizes. They are analogs of Mind Maps and find their application at many fields, and even in landscape design. At this case the bubbles are applied to illustrate the arrangement of different areas of future landscape design, such as lawns, flowerbeds, playgrounds, pools, recreation areas, etc. Bubble Diagram helps to see instantly the whole project, it is easy for design and quite informative, in most cases it reflects all needed information. Often Bubble Diagram is used as a draft for the future landscape project, on the first stage of its design, and in case of approval of chosen design concept is created advanced detailed landscape plan with specification of plants and used materials. Creation of Bubble Diagrams for landscape in ConceptDraw DIAGRAM software is an easy task thanks to the Bubble Diagrams solution from "Diagrams" area. You can use the ready scanned location plan as the base or create it easy using the special ConceptDraw libraries and templates.How To use Switches in Network Diagram
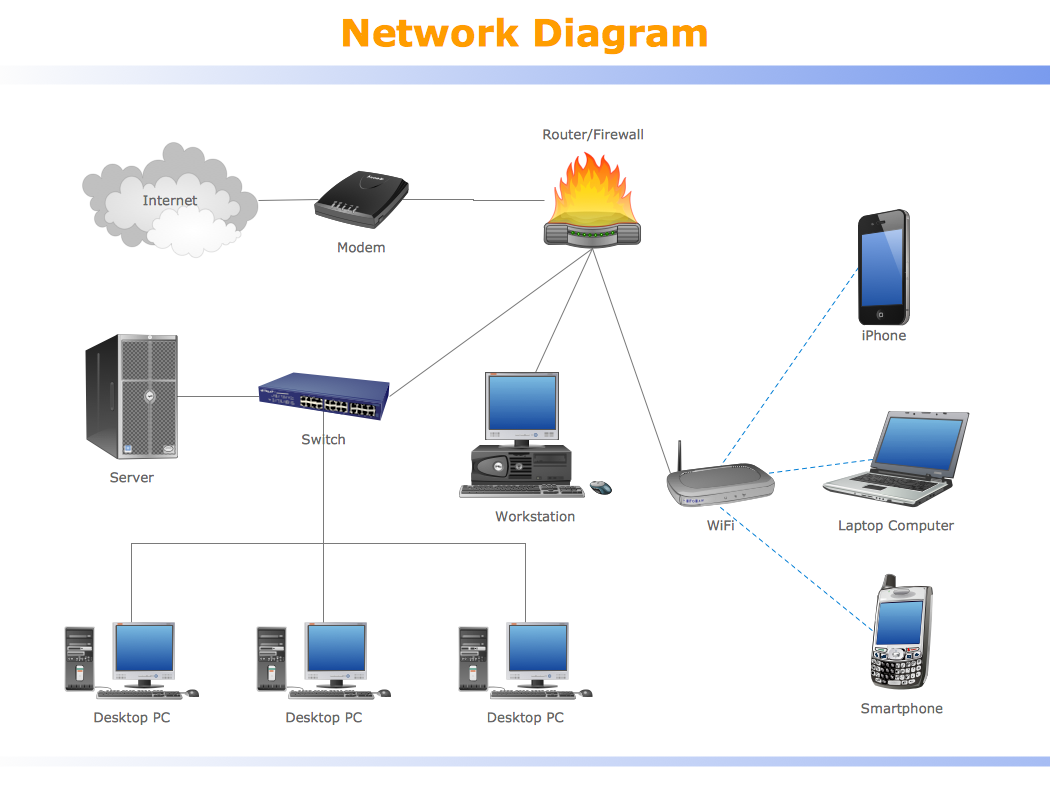
Special libraries of highly detailed, accurate shapes and computer graphics, servers, hubs, switches, printers, mainframes, face plates, routers etc.
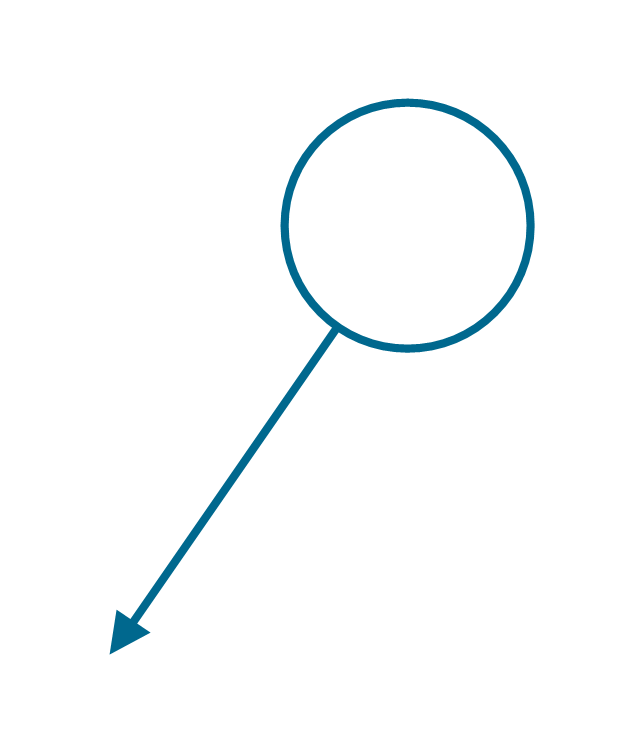
This vector stencils library contains 22 symbols of process annotations for setting automatic labels to display a datasheet field for a pipeline shape, labels, captions, outlines, off-sheet labels, text balloons, annotations, outlines, tags, and descriptions.
Use these shapes for drawing Process Flow Diagrams (PFD) and Piping and Instrumentation Diagrams (P&ID) in the ConceptDraw PRO software extended with the Chemical and Process Engineering solution from the Chemical and Process Engineering area of ConceptDraw Solution Park.
www.conceptdraw.com/ solution-park/ engineering-chemical-process
- Process Flowchart | Network diagrams with ConceptDraw PRO ...
- Process Flow Diagram Symbols | Design elements - HVAC controls ...
- Process Flowchart | Mechanical Design Software | Process Flow ...
- Basic Flowchart Symbols and Meaning | Process Flowchart | Rack ...
- Process Flow Diagram Symbols | Process Flowchart | Home ...
- Process Flowchart | Process Flow Diagram Symbols | Types of ...
- Basic Flowchart Symbols and Meaning | Bubble Chart | Process ...
- Process Flowchart | Process Flow Diagram Symbols | Types of ...
- Mechanical Engineering | Elements location of a welding symbol ...
- Process Flow Diagram Symbols | Piping and Instrumentation ...
- Maps and Directions | Directional Maps | Process Flow Chart ...
- Symbol Of Thermal Engineering
- Process Flowchart | Half Pipe Plans | Design elements - Process ...
- Process Flowchart | Process Flow Diagram Symbols | Chemical and ...
- Pressure Vessel Drawing And Symbol
- Flow chart Example. Warehouse Flowchart | How to Draw a ...
- Process Flowchart | Basic Flowchart Symbols and Meaning ...
- Process Flowchart | Making Mechanical Diagram | Accounting ...
- Elements location of a welding symbol | Welding symbols ...
- Mechanical Drawing Symbols | Process Flow Diagram Symbols ...


-process-annotations---vector-stencils-library.png--diagram-flowchart-example.png)
-process-annotations---vector-stencils-library.png--diagram-flowchart-example.png)

-process-annotations---vector-stencils-library.png--diagram-flowchart-example.png)
-process-annotations---vector-stencils-library.png--diagram-flowchart-example.png)
