This site uses cookies. By continuing to browse the ConceptDraw site you are agreeing to our Use of Site Cookies.

In searching of alternative to MS Visio for MAC and PC with ConceptDraw DIAGRAM

Many of us are acquainted with such a software product as MS Visio, which beyond any doubt, is a powerful and multifunctional tool. However, there may occur instances when this program turns incapable of meeting certain users' requirements; and then, the most optimum solution is quite difficult to find. But there is always an alternative. ConceptDraw DIAGRAM from CS Odessa Corporation has been developed to satisfy all your needs as an alternative product to Visio.

Visio for mac — ConceptDraw as an alternative to MS Visio. ConceptDraw has been developed to satisfy all your needs as a fully-functioned alternative product to MS Visio for Mac.

Is ConceptDraw DIAGRAM an Alternative to Microsoft Visio?

Visio for Mac and Windows - ConceptDraw as an alternative to MS Visio. ConceptDraw DIAGRAM delivers full-functioned alternative to MS Visio. ConceptDraw DIAGRAM supports import of Visio files. ConceptDraw DIAGRAM supports flowcharting, swimlane, orgchart, project chart, mind map, decision tree, cause and effect, charts and graphs, and many other diagram types.

ConceptDraw DIAGRAM Compatibility with MS Visio

For those who are migrating from MS Visio to ConceptDraw DIAGRAM, or for those who have colleagues and clients who use Visio, ConceptDraw DIAGRAM is compatible with MS Visio.VSDX formatted files.VSDX is Visio’s open XML file format, and it can be easily imported and exported by ConceptDraw DIAGRAM.
HelpDesk

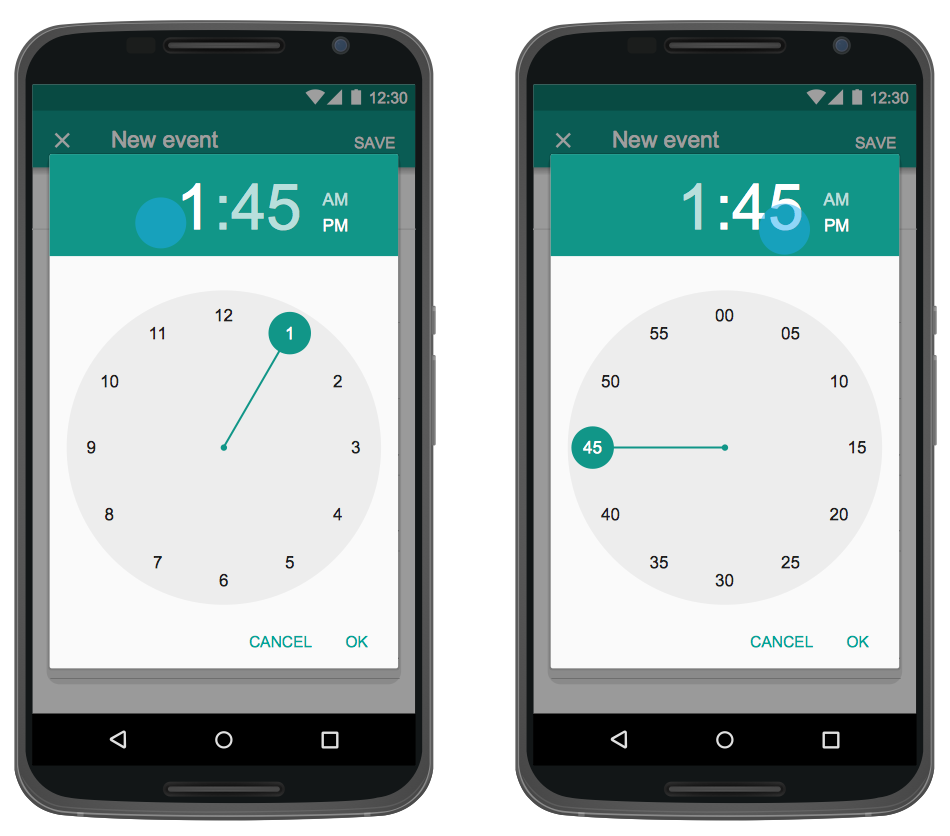
How to Design an Interface Mock-up of an Android Application

Uses Interface prototyping is much convenient when you can work through a diagram similar to the device design. ConceptDraw DIAGRAM allows you to develop Android User Interface (UI) prototypes using the special templates and vector libraries of the specific user interface elements. Using ConceptDraw DIAGRAM you can mock-up an Android UI system so that you can figure out how best to represent user interface (UI) elements for the development of a new mobile Apps.
HelpDesk

How to Draw a Divided Bar Chart

A divided bar graph is a rectangle divided into smaller rectangles along its length in proportion to the data. Segments in a divided bar represent a set of quantities according to the different proportion of the total amount. A divided bar diagram is created using rectangular bars to depict proportionally the size of each category. The bars in a divided bar graph can be vertical or horizontal. The size of the each rectangle displays the part that each category represents. The value of the exact size of the whole must be known, because the each section of the bar displays a piece of that value. A divided bar diagram is rather similar to a sector diagram in that the bar shows the entire data amount and the bar is divided into several parts to represent the proportional size of each category. ConceptDraw DIAGRAM in conjunction with Divided Bar Diagrams solution provides tools to create stylish divided bar charts for your presentations.

entity-relationship diagram, ER-diagram, database ERD Entity-Relationship Diagram (ERD)

entity-relationship diagram, ER-diagram, database ERD
Entity-Relationship Diagram (ERD) solution extends ConceptDraw DIAGRAM software with templates, samples and libraries of vector stencils from drawing the ER-diagrams by Chen's and crow’s foot notations.