 Entity-Relationship Diagram (ERD)
Entity-Relationship Diagram (ERD) solution extends ConceptDraw PRO software with templates, samples and libraries of vector stencils from drawing the ER-diagrams by Chen's and crow’s foot notations.
HelpDesk
How to Create a Venn Diagram in ConceptDraw PRO
Venn diagrams were invented by John Venn as a method of depicting relationships between different components. A Venn diagram consists of two or more circles. Each circle represents a specific group or set. The entities which are depicted by circles generally have some common characteristics. A Venn Diagram shows all the possible logical relations between these entities. Any properties that belong to more than one set should be indicated in the sections where the circles overlap. A Venn Diagram can be useful to visually summarize the status and future viability of a project. ConceptDraw PRO allows you to make a Venn diagrams using the Venn Diagrams solution.HelpDesk
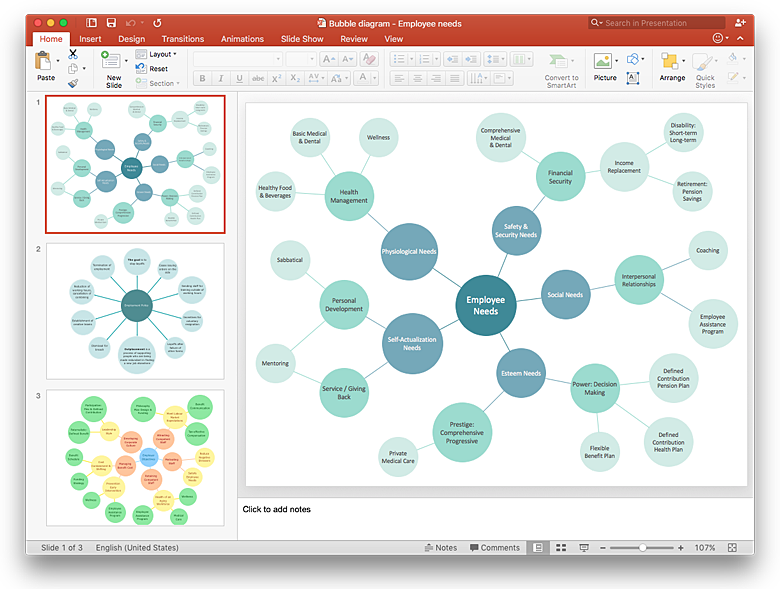
How to Add a Bubble Diagram to a PowerPoint Presentation Using ConceptDraw PRO
Bubble diagrams can be used to compare concepts, and identify areas of similarity and difference. ConceptDraw PRO allows you to make a MS PowerPoint Presentation from your charts in a few simple steps.- Design elements - ERD ( crow's foot notation ) | Entity Relationship ...
- Data Flow Diagram Symbols . DFD Library | Entity Relationship ...
- Structured Systems Analysis and Design Method (SSADM) with ...
- Crow's foot ERD - Educational data base
- What Symbols For Er Diagram By Crow Foot
- Entity Relationship Diagram Symbols and Meaning ERD Symbols ...
- Data Flow Diagrams | Entity Relationship Diagram Examples ...
- Design elements - ER diagram (Chen notation ) | Entity Relationship ...
- Entity Relationship Diagram Symbols and Meaning ERD Symbols ...
- Entity Relationship Diagram Symbols and Meaning ERD Symbols ...
- Entity-relationship diagram ( Crow's foot notation ) | Structured ...
- What Is ER Diagram Draw A Simple ER Diagram
- Entity Relationship Diagram Software for Design Crows Foot ER ...
- Design elements - ERD ( crow's foot notation ) | Entity Relationship ...
- Gane Sarson Diagram | Data Flow Diagram Process | Data flow ...
- Entity-Relationship Diagram (ERD) | ERD Symbols and Meanings ...
- Entity Relationship Diagram Software Engineering | Entity ...
- Design Element: Basic Network for Network Diagrams | Entity ...
- Entity-Relationship Diagram (ERD) with ConceptDraw PRO ...
- Entity Relationship Diagram Symbols and Meaning ERD Symbols ...

