 Basic Diagramming
This solution extends ConceptDraw PRO software with the specific tools you need to easily draw flowcharts, block diagrams, histograms, pie charts, divided bar diagrams, line graphs, circular arrows diagrams, Venn diagrams, bubble diagrams and concept maps
HelpDesk
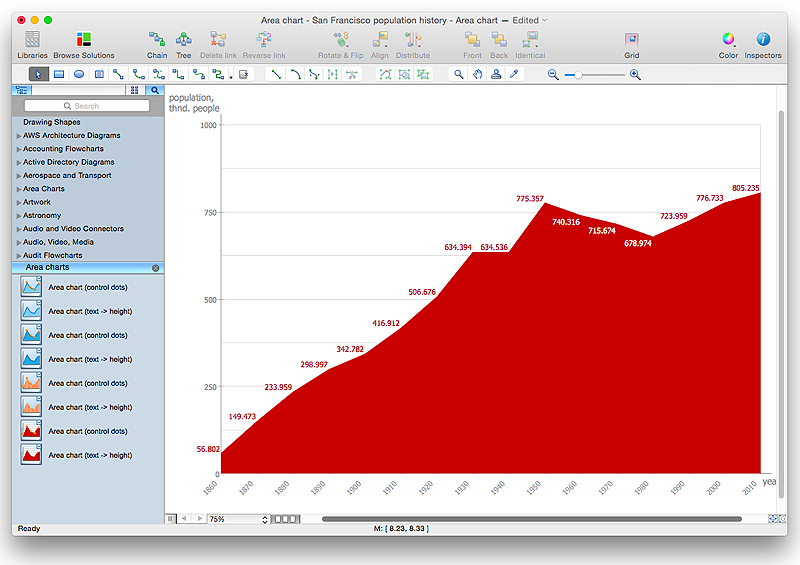
How to Draw an Area Chart in ConceptDraw PRO
Area chart is similar to a line chart, but an area chart has an area, commonly filled with color below the line. The applying of Line charts and area charts are also very similar. They both show continuity across a data set. They are both can be used for displaying time series data and for depicting tendencies better than separate values, but they have some different characteristics. Using the proper one is good chance to show once again a professionalism of your graphic documents. An area chart depicts a colored area below the line. The sum on the vertical axis of an area chart represents the entire value, while the height of each separate piece shows its parts. Area charts are used to display multiple data series with proportion to a whole value , or for separate data series showing a set of countable values, or cumulative data.HelpDesk
How to Connect Text Data to a Time Series Chart on Your Live Dashboard
Time Series Dashboard means an integration of some type of diagrams: Line Charts, Bar Charts, Column Charts, and Dot Plots on a single space. The ConceptDraw Time Series Dashboard solution can be used to create the interactive Time Series dashboard. The libraries of Time Series Charts solution contain the Live Objects, that can change their appearance depending on the external data. Each chart from the Time Series dashboard displays particular source data. You can include Time Series Charts in your business or technical dashboards to show and compare the items changing over time.
 What are Infographics Area
Solutions of the area What is Infographics from ConceptDraw Solution Park collect templates, samples and vector stencils libraries with design elements for the drawing information graphics.
- Basic Diagramming | Line Chart Template for Word | Line Graph ...
- Basic Diagramming | Simple Diagramming | Simple Drawing ...
- Line Graph Charting Software | Basic Diagramming | How to Create ...
- Basic Diagramming | Picture Graphs | Create Graphs and Charts ...
- Basic Diagramming | The Best Drawing Program for Mac | Create ...
- The Best Drawing Program for Mac | Scatter Chart Examples | Line ...
- Create Graphs and Charts | Graphs and Charts Area | Basic ...
- Create Graphs and Charts | Basic Diagramming | Line Graph ...
- Line Chart Templates
- Picture Graphs | Line Graphs | Bar Graphs | Graphs
- Basic Diagramming | Flowchart Example: Flow Chart of Marketing ...
- Create Graphs and Charts | Line Graph Charting Software ...
- Line Chart Examples
- Basic Diagramming | Simple Drawing Applications for Mac | Polar ...
- Create Graphs and Charts | Basic Diagramming | The Best Drawing ...
- Create Graphs and Charts | How to Create a Line Chart | Line ...
- Pie Chart Examples | Pie Chart Software | Basic Diagramming ...
- Sales Growth. Bar Graphs Example | Financial Comparison Chart ...
- Line Graph Charting Software | Line Chart Examples | How to ...
- Pie Chart Examples | Bar Chart Examples | Flow Chart Diagram ...

