This sample was created on the base of the puzzles diagram from the webpage "Ramp Management and Control" of US Department of Transportation Federal Highway Administration website.
[ops.fhwa.dot.gov/ publications/ ramp_ mgmt_ handbook/ brochure/ brochure.htm]
"What is Ramp Management?
Ramp Management is the…“application of control devices, such as traffic signals, signing, and gates to regulate the number of vehicles entering or leaving the freeway, in order to achieve operational objectives”.
Ramp Management Strategies.
There are four accepted and proven strategies to manage ramp-based traffic:
(1) Ramp Metering - The use of traffic signal(s) deployed alongside a ramp to control the rate at which vehicles enter a freeway facility.
(2) Ramp Closure - Ramp closure involves the use of gates, barriers or cones to restrict vehicle access to a ramp. Closures can be permanent, temporary, or scheduled.
(3) Special Use Treatments - Special use treatments give “special” consideration to a vehicle class or classes to improve safety, improve traffic conditions, and/ or encourage specific types of driving behavior.
(4) Ramp Terminal Treatments - Ramp terminal treatments are solutions to problems that occur at or near ramp/ arterial intersections. ...
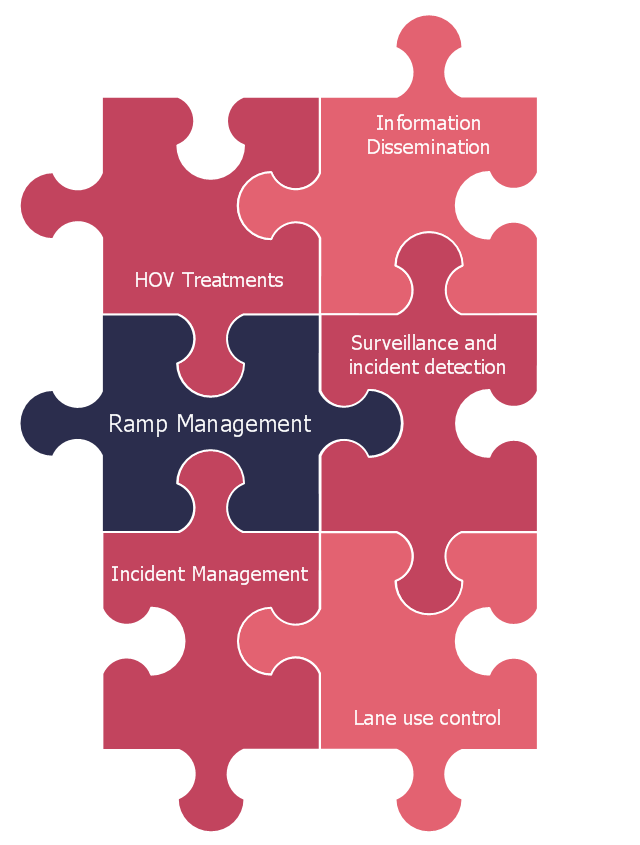
The Relationship between Ramp Management and Freeway Management.
Ramp management is a single function that typically falls under the freeway management umbrella. Ramp management elements work with other elements of freeway management (e.g., HOV Treatments and Incident Management) to deliver freeway management system goals and objectives. This relationship can be likened to puzzle pieces with ramp management representing one of the pieces that need to collectively come together to ensure successful operations. In addition to freeway management, ramp management should also be coordinated closely with arterial management, transit management, and other parts of the overall surface transportation system." [ops.fhwa.dot.gov/ publications/ ramp_ mgmt_ handbook/ brochure/ brochure.htm]
The puzzles diagram example "The relationship between ramp management and freeway management" was created using the ConceptDraw PRO diagramming and vector drawing software extended with the Marketing Diagrams solution from the Marketing area of ConceptDraw Solution Park.
[ops.fhwa.dot.gov/ publications/ ramp_ mgmt_ handbook/ brochure/ brochure.htm]
"What is Ramp Management?
Ramp Management is the…“application of control devices, such as traffic signals, signing, and gates to regulate the number of vehicles entering or leaving the freeway, in order to achieve operational objectives”.
Ramp Management Strategies.
There are four accepted and proven strategies to manage ramp-based traffic:
(1) Ramp Metering - The use of traffic signal(s) deployed alongside a ramp to control the rate at which vehicles enter a freeway facility.
(2) Ramp Closure - Ramp closure involves the use of gates, barriers or cones to restrict vehicle access to a ramp. Closures can be permanent, temporary, or scheduled.
(3) Special Use Treatments - Special use treatments give “special” consideration to a vehicle class or classes to improve safety, improve traffic conditions, and/ or encourage specific types of driving behavior.
(4) Ramp Terminal Treatments - Ramp terminal treatments are solutions to problems that occur at or near ramp/ arterial intersections. ...
The Relationship between Ramp Management and Freeway Management.
Ramp management is a single function that typically falls under the freeway management umbrella. Ramp management elements work with other elements of freeway management (e.g., HOV Treatments and Incident Management) to deliver freeway management system goals and objectives. This relationship can be likened to puzzle pieces with ramp management representing one of the pieces that need to collectively come together to ensure successful operations. In addition to freeway management, ramp management should also be coordinated closely with arterial management, transit management, and other parts of the overall surface transportation system." [ops.fhwa.dot.gov/ publications/ ramp_ mgmt_ handbook/ brochure/ brochure.htm]
The puzzles diagram example "The relationship between ramp management and freeway management" was created using the ConceptDraw PRO diagramming and vector drawing software extended with the Marketing Diagrams solution from the Marketing area of ConceptDraw Solution Park.
Marketing diagram
Flowchart Marketing Process. Flowchart Examples

HelpDesk
How to Create Infographics that Help People Eat Healthy

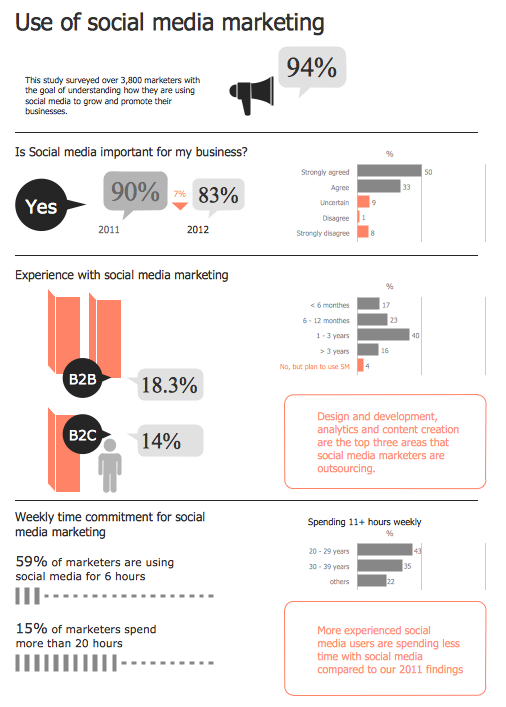
Social Media Marketing Infographic
What Is a Concept Map

How to Draw a Bubble Chart

Software development with ConceptDraw DIAGRAM

Fault Tree Diagram

 Sales Flowcharts
The Sales Flowcharts solution lets you create and display sales process maps, sales process workflows, sales steps, the sales process, and anything else involving sales process management.
- Free Brochure Template Download
- Brochure Template Free Download
- Free Pamphlet Maker Download
- What Is A Single Page Front And Back Brochure Called
- What Is A Brochure
- A single currency to boots the Single Market | Cloud round icons ...
- Financial Trade UML Use Case Diagram Example | Process ...
- Process Flowchart | The relationship between ramp management ...
- Single Bar Chart
- Flowchart Marketing Process. Flowchart Examples | Work Order ...