This site uses cookies. By continuing to browse the ConceptDraw site you are agreeing to our Use of Site Cookies.

draw area chart, draw area graph Area Charts

draw area chart, draw area graph
Area Charts are used to display the cumulative totals over time using numbers or percentages; or to show trends over time among related attributes. The Area Chart is effective when comparing two or more quantities. Each series of data is typically represented with a different color, the use of color transparency in an object’s transparency shows overlapped areas and smaller areas hidden behind larger areas.

Basic Flowchart Symbols and Meaning

Flowchart Symbols and Meaning - Provides a visual representation of basic flowchart symbols and their proposed use in professional workflow diagram, standard process flow diagram and communicating the structure of a well-developed web site, as well as their correlation in developing on-line instructional projects. See flowchart's symbols by specifics of process flow diagram symbols and workflow diagram symbols.
How to Build a Flowchart

The Best Tool for Business Process Modeling

The EPC diagram shows various business processes in terms of work flows.
Event-Driven Process chain Diagrams for improvement throughout an organisation.
ConceptDraw DIAGRAM - software that reduces the time needed to create a business process model and is great business process improvement tools.

How to Build a Flowchart

The ConceptDraw DIAGRAM is a professional software for quick creating great looking flowcharts. The vector stencils from object libraries allows you to use RapidDraw technology. By the clicking on direction arrows one can add new object to flowcharts. This technology gives to users the ability to fast creating visualization for the structural data.
Learn the basics of flowcharting and see how to build create a flowchart using ConceptDraw automatic drawing tools.

Column Chart Software

ConceptDraw Column Chart software allows drawing column charts using predesigned objects or drawing tools. In ConceptDraw Column Chart software you can find a complete set of column chart tools and objects.
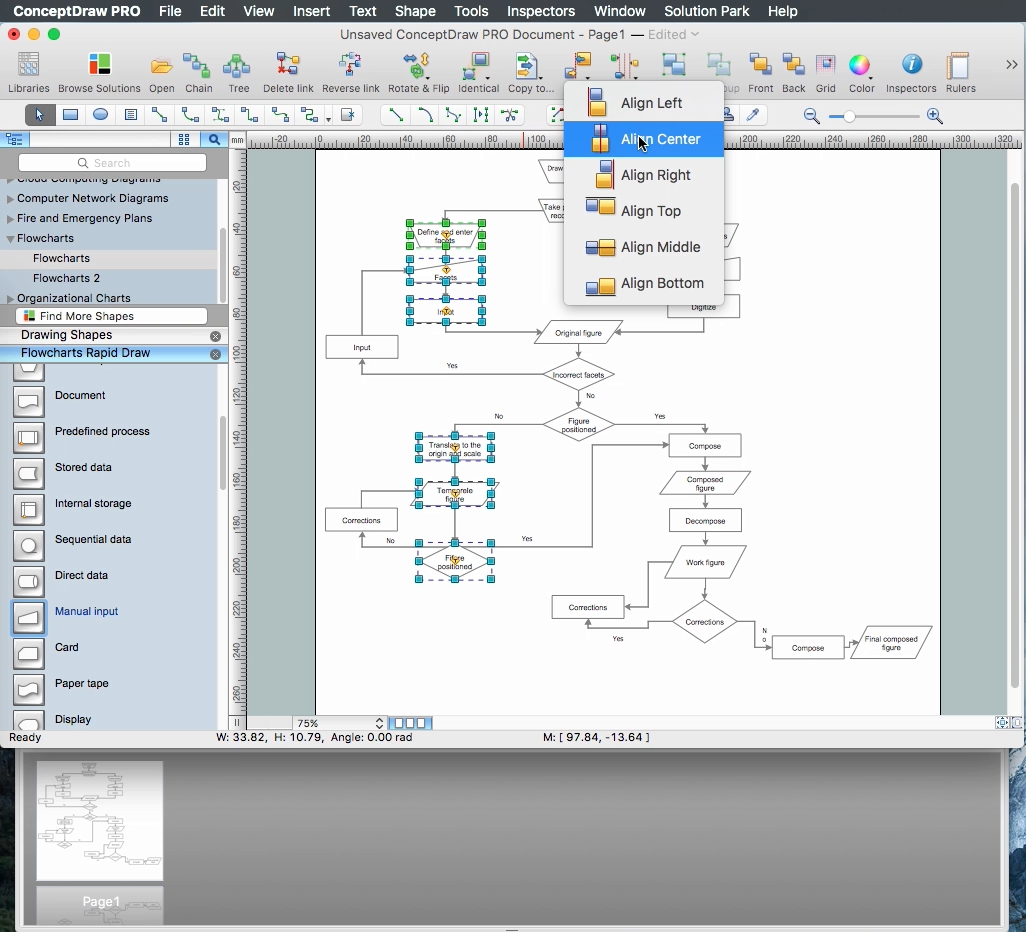
The vector stencils library "Mac OS X Lion user interface" contains 52 UI design elements.
Use it for designing Mac OS X Lion graphic user interface (GUI) of software for Apple computers in the ConceptDraw PRO diagramming and vector drawing software extended with the Graphic User Interface solution from the Software Development area of ConceptDraw Solution Park.
Title Bar
Title Bar, title bar,
Title Bar Inactive
Title Bar Inactive, title bar,
Window
Window, window,
Window Inactive
Window Inactive, window,
Window Title Bar
Window Title Bar, window,
Window Title Bar (Inactive)
Window Title Bar (Inactive), window,
Full Screen Button
Full Screen Button, full screen button,
Exit Full Screen Button
Exit Full Screen Button, exit full screen button,
Window without Bar
Window without Bar, window,
Window (Narrow Toolbar)
Window (Narrow Toolbar), window,
Window Inactive (Narrow Toolbar)
Window Inactive (Narrow Toolbar), window,
Panel (Hud Window)
Panel (Hud Window), panel,
Panel (Hud Window) (Inactive)
Panel (Hud Window) (Inactive), panel,
Box 1
Box 1, box,
Box 2
Box 2, box,
Field
Field, field,
List View 1
List View 1, list view,
List View 2
List View 2, list view,
Scroll Bar Vertical
Scroll Bar Vertical, scroll bar,
Scroll Bar Horizontal
Scroll Bar Horizontal, scroll bar,
Main Menu
Main Menu, main menu,
Menu Bar
Menu Bar, menu bar,
Menu
Menu, menu,
Vertical Line
Vertical Line,
Horizontal Line
Horizontal Line,
Apple Menu
Apple Menu, Apple menu,
Arrow mark
Arrow mark, arrow,
Combo Box
Combo Box, combo box,
Pop Up Menu
Pop Up Menu, pop up menu,
Text Field
Text Field, text input field,
Count Button
Count Button, count button,
Search Field
Search Field, search field,
Check Box
Check Box, check box,
Check Box
Check Box, check box,
Group of Check Boxes
Group of Check Boxes, group of check boxes,
Radio Button
Radio Button, radio button,
Radio Button
Radio Button, radio button,
Group of Radio Buttons
Group of Radio Buttons, group of radio buttons,
Linear Slider (round thumb)
Linear Slider (round thumb), linear slider,
Linear Slider (directional thumb)
Linear Slider (directional thumb), linear slider,
Circular Slider
Circular Slider, circular slider,
Color Well
Color Well, color well,
Relevance Indicator
Relevance Indicator, relevance indicator,
Rating Indicator
Rating Indicator, rating indicator,
Indeterminate Progress Bar
Indeterminate Progress Bar, progress bar,
Determinate Progress Bar
Determinate Progress Bar, progress bar,
Continuous Capacity Indicator
Continuous Capacity Indicator, capacity indicator,
Discrete Capacity Indicator
Discrete Capacity Indicator, capacity indicator,
Discrete Capacity Indicator (yellow)
Discrete Capacity Indicator (yellow), capacity indicator,
Discrete Capacity Indicator (red)
Discrete Capacity Indicator (red), capacity indicator,
Asynchronous Progress Indicator
Asynchronous Progress Indicator, progress indicator,
Circular Progress Indicator
Circular Progress Indicator, progress indicator,

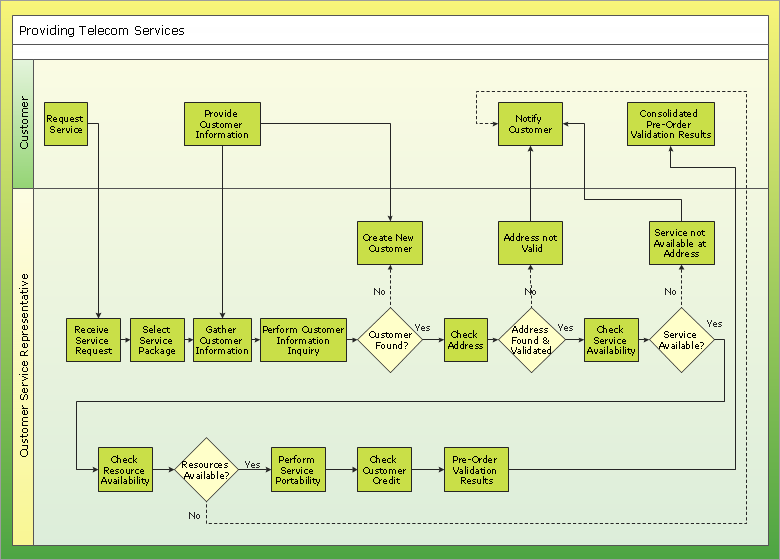
Double-headed Cross Functional Flowchart

ConceptDraw DIAGRAM is a powerful tool that helps you create a Cross Functional Flow Chart quickly and easily. Fine-tuning the objects in ConceptDraw DIAGRAM allows you to create a really professional finished article. ConceptDraw Arrows10 Technology gives drawing connectors a smart behavior that provides quick and precise placement, allows for easy changes and automatic rearrangement.

business process flow diagram, business process optimization, business process workflow diagram Business Process Workflow Diagrams

business process flow diagram, business process optimization, business process workflow diagram
The Business Process Workflow Diagrams solution enhances the ConceptDraw DIAGRAM functionality with predesigned examples, samples and a numerous collection of predesigned vector objects of workflow chart elements, icons, arrows, connectors, and varied wor

Local area network (LAN). Computer and Network Examples

A local area network (LAN) is a devices network that connect with each other in the scope of a home, school, laboratory, or office. Usually, a LAN comprise computers and peripheral devices linked to a local domain server. All network appliances can use a shared printers or disk storage. A local area network serve for many hundreds of users. Typically, LAN includes many wires and cables that demand a previously designed network diagram. They are used by IT professionals to visually document the LANs physical structure and arrangement.
ConceptDraw - Perfect Network Diagramming Software with examples of LAN Diagrams. ConceptDraw Network Diagram is ideal for network engineers and network designers who need to draw Local Area Network diagrams.
How to Draw a Computer Network

ConceptDraw DIAGRAM Comparison with Omnigraffle Professional and MS Visio

ConceptDraw DIAGRAM Comparison with Omnigraffle Professional and MS Visio. All source ConceptDraw documents are vector graphic documents. They are available for reviewing, modifying, or converting to a variety of formats: PDF file, MS PowerPoint, MS Visio, and many other graphics formats.