Pyramid Diagram and Pyramid Chart
Pyramid Diagram, Triangle Chart or Triangular Diagram is a convenient and useful type of diagrams, which lets represent the data hierarchical structure and to illustrate the foundation-based relationships between the hierarchy levels. Pyramid Diagrams are used to visualize effectively the hierarchical, as well as proportional and foundation-based relationships, the process steps, the interconnections of organizational layers or topics. ConceptDraw PRO software enhanced with Pyramid Diagrams solution from Marketing area of ConceptDraw Solution Park is a powerful business charting software, that includes all required tools for designing the multilevel Pyramid Diagrams as quickly as possible. The build-in vector stencils and templates are the great aid for designers, a variety of examples and samples is a good base and source of inspiration. Use attractive and vivid 2D and 3D Pyramid Diagrams and Triangle Charts designed in ConceptDraw PRO to illustrate your documents, presentations, infographics, articles, reports, websites, etc.Basketball Court Diagram and Basketball Positions
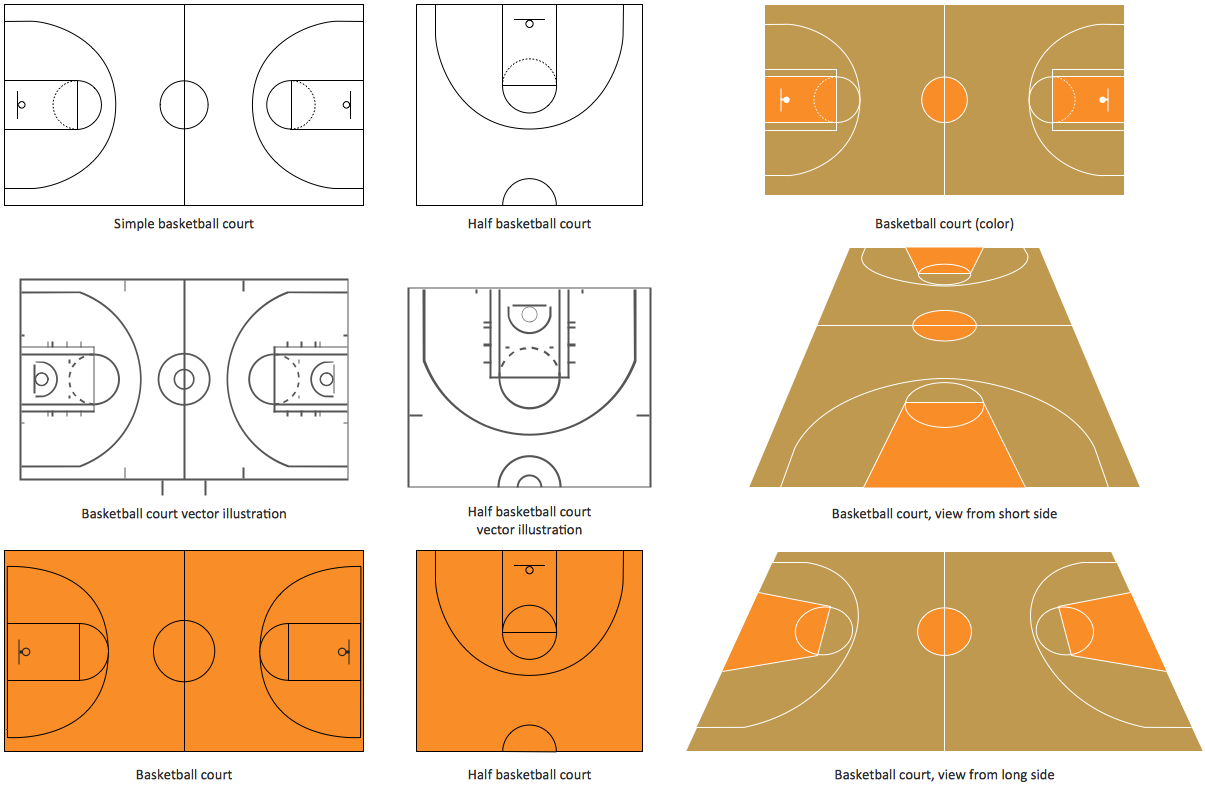
The illustration of possible situations during the basketball matches, presentation of basketball positions and the best tactics, explanation of rules and training to successful game, become much more easier and time saving with visual illustrations and drawings. Creation of several illustrations and comparing them lets effectively show the differences and advantages in positions of players. ConceptDraw PRO software extended with Basketball solution from Sport area of ConceptDraw Solution Park provides the shapes' libraries with different kinds of basketball courts and basketball positions, templates and samples, which will render great help for basketball specialists and fans in drawing professional-looking and illustrative basketball-related diagrams and schematics of any complexity in a few minutes. Extensive export capabilities of ConceptDraw PRO to varied graphical formats open before you wide field for activities and possibility to easy communicate with large quantity of people, which have different software installed on their devices.How To use House Electrical Plan Software
How we can conduct the electricity at house correctly without a plan? It is impossible. The House electrical diagram depicts locations of switches, outlets, dimmers and lights, and lets understand how you will connect them. But design of House Electrical Plan looks a complex task at a glance, which requires a lot of tools and special experience. But now all is simple with all-inclusive floor plan software - ConceptDraw PRO. As a house electrical plan software, the ConceptDraw PRO contains libraries with a large range of professional lighting and electrical symbols, ready-to-use electrical plans samples and examples, and built-in templates for creating great-looking Home floor electrical plans. It is a fastest way to draw Electrical circuit diagrams, Electrical wiring and Circuit schematics, Digital circuits, Electrical equipment, House electrical plans, Satellite television, Cable television, Home cinema, Closed-circuit television when are used the tools of Electric and Telecom Plans Solution from ConceptDraw Solution Park. Files created in Visio for Mac app can be easily imported to ConceptDraw PRO. Also you may import stencils and even libraries. Try for free an alternative to Visio that Apple users recommend.
- Block diagram - Six markets model
- Block diagram - Six markets model
- Flow chart Example. Warehouse Flowchart | Daigram Of Flow Of ...
- Relationship marketing | Block diagram - Six markets model | Six ...
- Relationship marketing | Venn Diagram Examples | Six Markets ...
- HVAC Marketing Plan | Block diagram - Six markets model | Pyramid ...
- Six Markets Model Chart | Block diagram - Six markets model | Venn ...
- Relationship marketing | Venn diagram - Relationship marketing ...
- Process Flowchart | Copying Service Process Flowchart. Flowchart ...
- Sector diagram - Template | Process Flowchart | How To Create ...
- Block diagram - Six markets model | Functional Flow Block Diagram ...
- Lean Manufacturing Diagrams | Lean Six Sigma Diagram Software ...
- Diagram Of The Market
- Geo Map - United States of America Map | Lean Six Sigma Diagram ...
- Pyramid Diagram and Pyramid Chart | Six Markets Model Chart ...
- Manufacturing 8 Ms fishbone diagram - Template | How Do ...
- Flowchart Marketing Process. Flowchart Examples | Marketing ...
- Marketing mix - Wheel diagram | Target Diagram | Daily Schedule ...
- Fully Connected Network Topology Diagram | Network Topologies ...
- Example of DFD for Online Store (Data Flow Diagram ) DFD ...


