Lean Six Sigma Diagram Software
Lean Six Sigma (LSS) is a well-known in all over the world methodology of quality improvement and business perfection. ConceptDraw PRO diagramming and vector drawing software is a powerful Lean Six Sigma Diagram Software thanks to the included Value Stream Mapping solution from the Quality Management Area of ConceptDraw Solution Park.Lean Manufacturing Diagrams
The Value Stream Mapping solution continues to extend the range of ConceptDraw PRO into a business graphics tool that can be used to document processes of Lean Manufacturing.Audit Flowchart Symbols
The audit is a complex process consisting of defined quantity of steps, which have as a final goal the ensuring of success of a certain business project. It includes the independent examination of data, statements and financial performances of an enterprise for a stated purpose. It is convenient to construct the Audit Flowcharts or Audit Diagrams for visual representation and structuring the audit processes. ConceptDraw PRO diagramming software enhanced with Audit Flowcharts solution from the Finance and Accounting area of ConceptDraw Solution Park effectively helps to draw the Audit Diagrams for accounting, finance and money management, the Audit Flowcharts for fiscal information tracking, financial inventories and documenting Six Sigma, the decision making Flow Charts, etc. This solution provides the powerful drawing tools, numerous templates and samples, and large quantity of vector audit flowchart symbols that greatly facilitate the process of representation the audit steps and audit results, and designing efficient and visually appealing Audit Flowcharts.Business Process Flow Diagram
Business Process Flow Diagram is a graphical presentation of business processes and process flows. It is one of the main tool of business analysis and business process re-engineering that lets identify and easy understand process flows within organization. ConceptDraw PRO extended with Business Process Workflow Diagrams solution from the Business Processes area of ConceptDraw Solution Park is a powerful software which lets easy design Business Process Flow Diagram of any complexity.SIPOC Diagram
SIPOC is a tool that summarizes the inputs and outputs of one or more processes in table form. You need to draw professional looking SIPOC Diagram quick and easy? Pay please your attention on ConceptDraw PRO diagramming and vector drawing software. Extended with Business Process Mapping Solution from the Business Processes Area of ConceptDraw Solution Park, it suits ideal for this.Constant improvement of key performance indicators
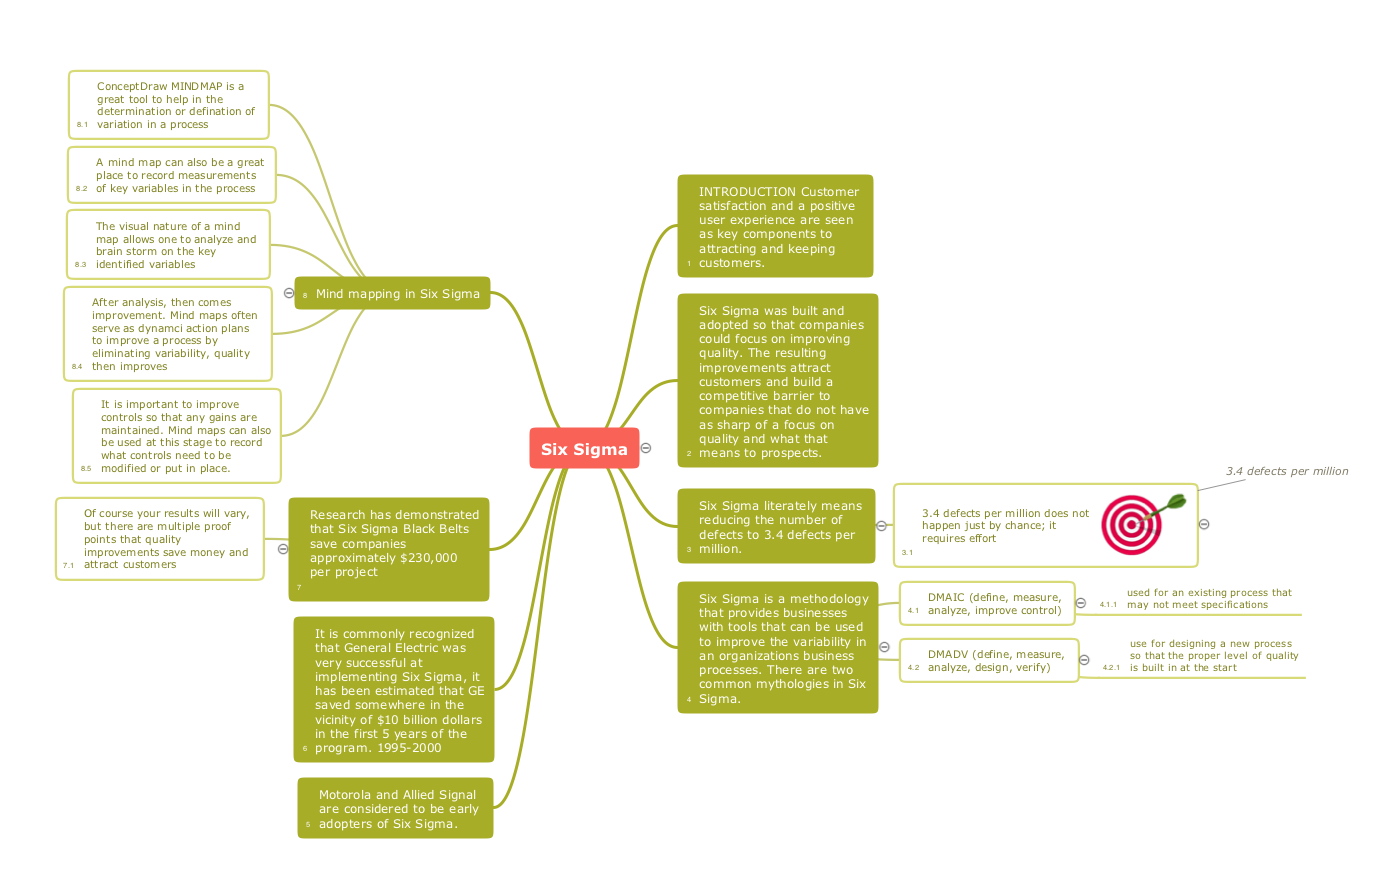
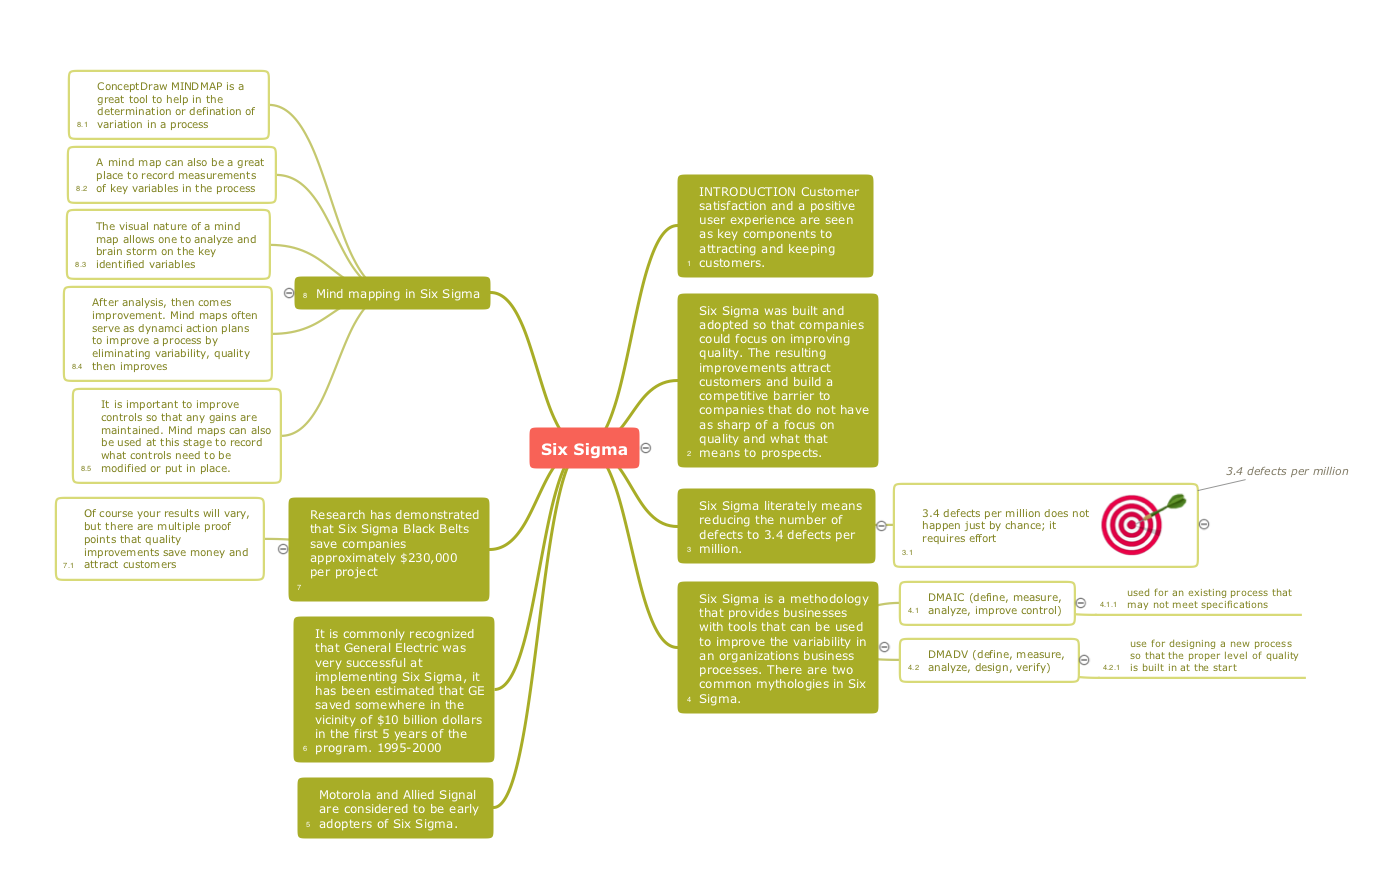
There are available tool to lend a fresh look to quality procedures - ConceptDraw MINDMAP.Business Processes
The most worked out and commonly used methodology of business processes description is IDEF methodology. Besides business processes it allows to describe functional blocks, for example production and marketing. ConceptDraw lets creation of business processes description using IDEF0 and IDEF2 methods.Basic Audit Flowchart. Flowchart Examples
This sample shows the Audit Process Flowchart. It was created in ConceptDraw PRO diagramming and vector drawing software using the Flowcharts solution from the Diagrams area of ConceptDraw Solution Park. The Audit Flowcharts are widely used in the financial management, accounting, money management and in many others fields.Quality Mind Maps - samples and templates
Use samples and templates to describe your own quality processes, brainstorm, and structure quality issues.Value-Stream Mapping for Manufacturing
Create value stream maps - for value stream analysis and value stream management, material and information flow mapping, using our quick start templates included with ConceptDraw.Types of Flowcharts
A Flowchart is a graphical representation of process, algorithm, workflow or step-by-step solution of the problem. It shows the steps as boxes of various kinds and connects them by arrows in a defined order depicting a flow. There are twelve main Flowchart types: Basic Flowchart, Business Process Modeling Diagram (BPMN), Cross Functional Flowchart, Data Flow Diagram (DFD), IDEF (Integrated DEFinition) Flowchart, Event-driven Process Chain (EPC) Diagram, Influence Diagram (ID), Swimlane Flowchart, Process Flow Diagram (PFD), Specification and Description Language (SDL) Diagram, Value Stream Mapping, Workflow Diagram. Using the Flowcharts solution from the Diagrams area of ConceptDraw Solution Park you can easy and quickly design a Flowchart of any of these types. This solution offers a lot of special predesigned vector symbols for each of these widely used notations. They will make the drawing process of Flowcharts much easier than ever. Pay also attention for the included collection of ready Flowchart examples, samples and quick-start templates. This is business process improvement tools. If you are looking for MS Visio for your Mac, then you are out of luck, because it hasn't been released yet. However, you can use Visio alternatives that can successfully replace its functions. ConceptDraw PRO is an alternative to MS Visio for Mac that provides powerful features and intuitive user interface for the same.
Process Mapping
ConceptDraw PRO diagramming and vector drawing software offers the unique Business Process Mapping Solution from the Business Processes Area of ConceptDraw Solution Park. Powerful drawing tools of this solution make it effective Business Process Mapping software and help easy design professional looking business process diagrams and flowcharts.Audit Process Flowchart. Audit Flowchart
Audit Process Flowchart, Audit Flowchart - Audit Flowcharts solution for ConceptDraw PRO Solution Park provides the Audit Flowcharts library with wide variety of predesigned audit flowchart symbols, and also the set of templates and samples allowing you design your own audit flowchart or audit process flowchart in one moment. Simply use any of offered samples and change it for your needs, or fill the desired template.Software Flow Chart
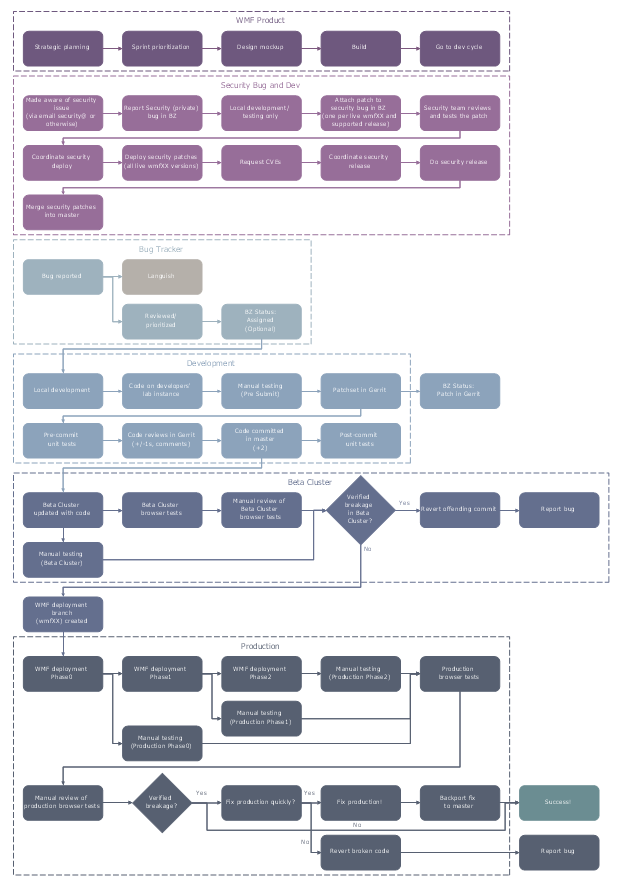
Many professionals have to solve problems every day. Designing of the process algorithm contribute to understand where the problem is in the process. A Flowchart is a graphical tool that most usable for breaking down processes. Definition of flowchart - a diagram that shows step-by-step progression through a procedure or system especially using connecting lines and a set of conventional symbols. All the icons, symbols and connectors needed for creating standardized notation flowcharts are contained within Software Flow Chart.Quality Improvement
Constant improvement of key performance indicators that are related to quality is a step in the right direction for a company interested in market growth.- Registers, drills and diffusers - Vector stencils library | Lean Six ...
- Stable Icon Png
- Analyze Clipart Png
- Lean Six Sigma Diagram Software | Basic Flowchart Symbols and ...
- Sector Vector Png
- Quality Clipart Png
- Circle For Numbers Vector Png
- Award Logo Vector Png
- Process Flowchart | Lean Six Sigma Diagram Software | Active ...
- Market Research For Creative Ideas Png Vectors
- Decision Making Clipart Png
- Design elements - Workflow diagram | Six Markets Model Chart ...
- Lean Manufacturing Diagrams | Lean Six Sigma Diagram Software ...
- Geo Map - United States of America Map | USA Maps | Lean Six ...
- Management pictograms - Vector stencils library | Audit Flowchart ...
- Statistical Idea Clipart Png
- Process Improvement | Lean Six Sigma Diagram Software | Mind ...
- Logistic Truck Vector Png
- Value stream mapping - Vector stencils library | Design elements ...
- Military Shapes Design Png


