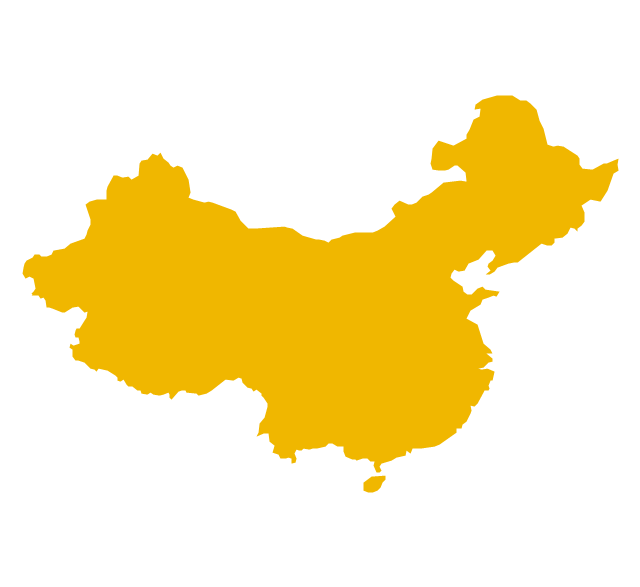
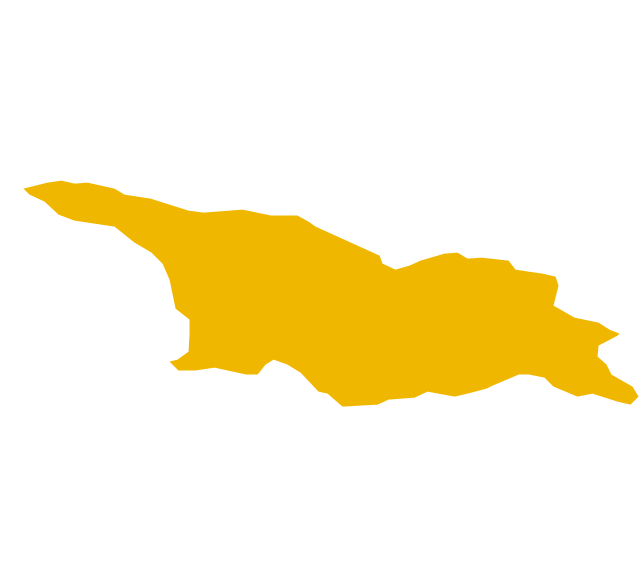
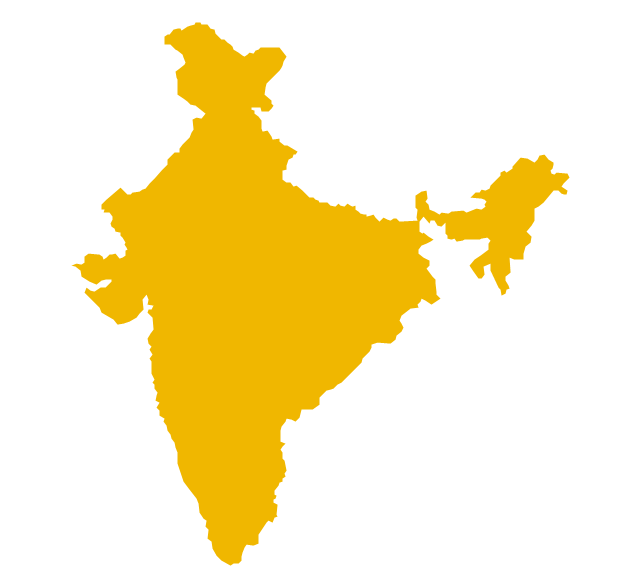
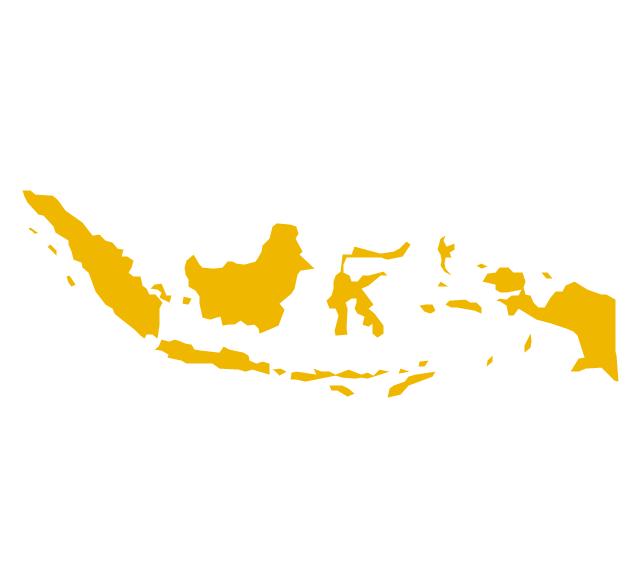
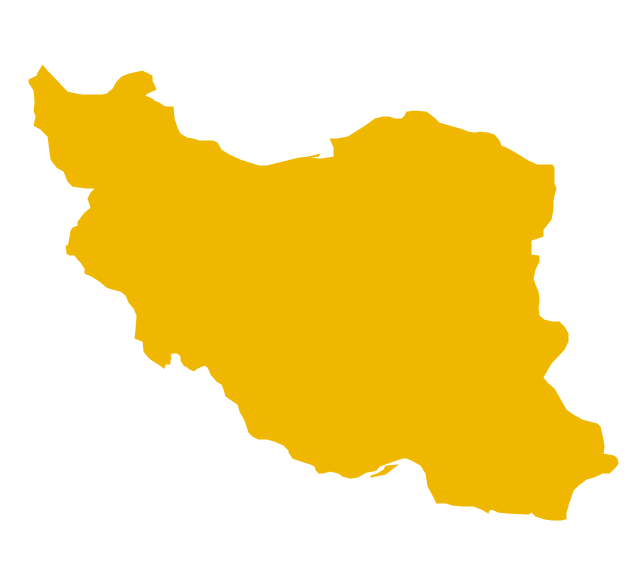
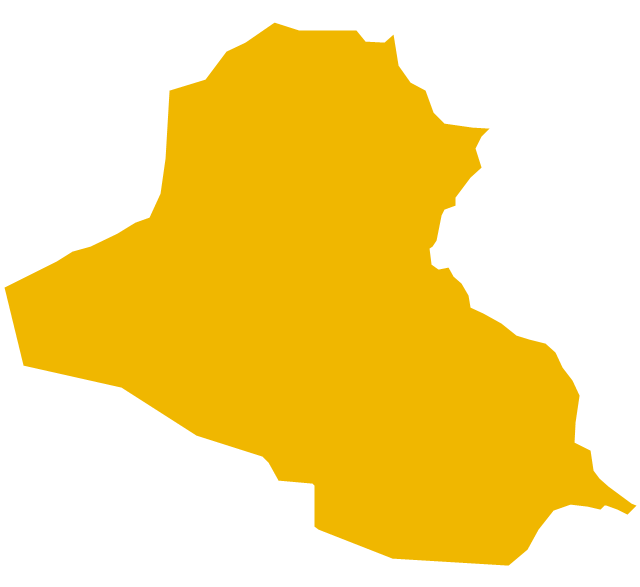
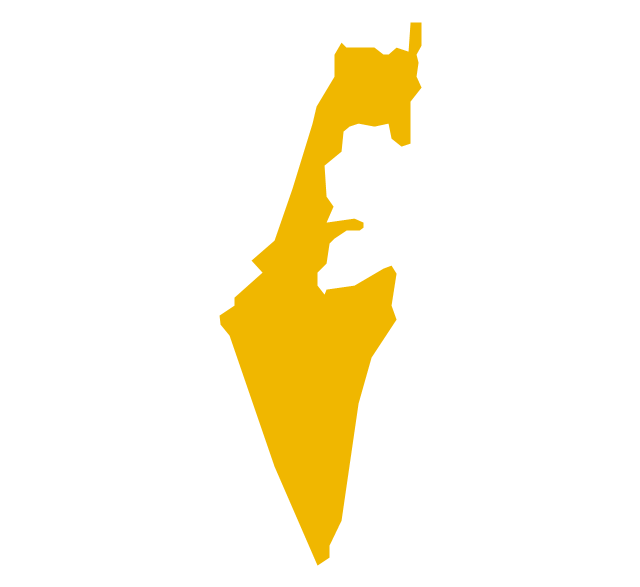
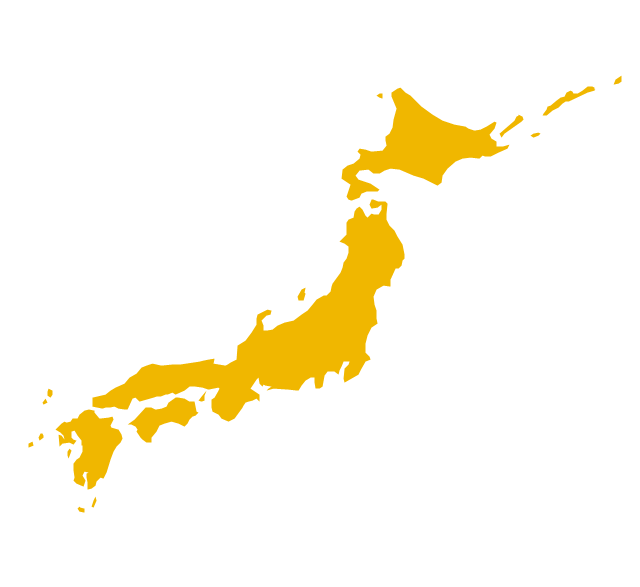
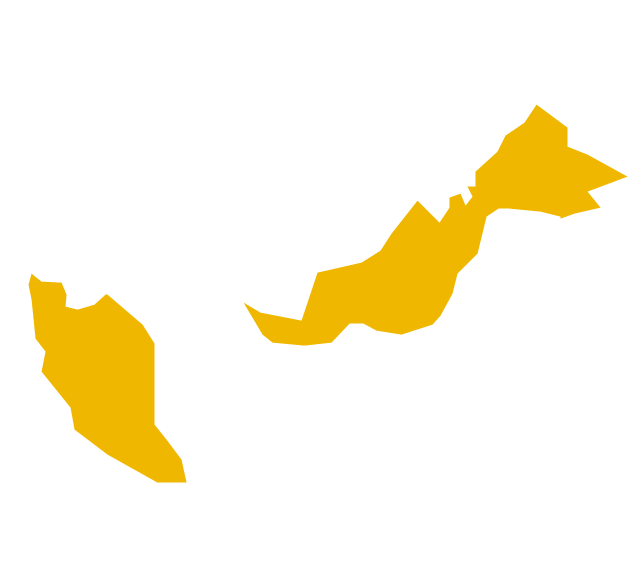
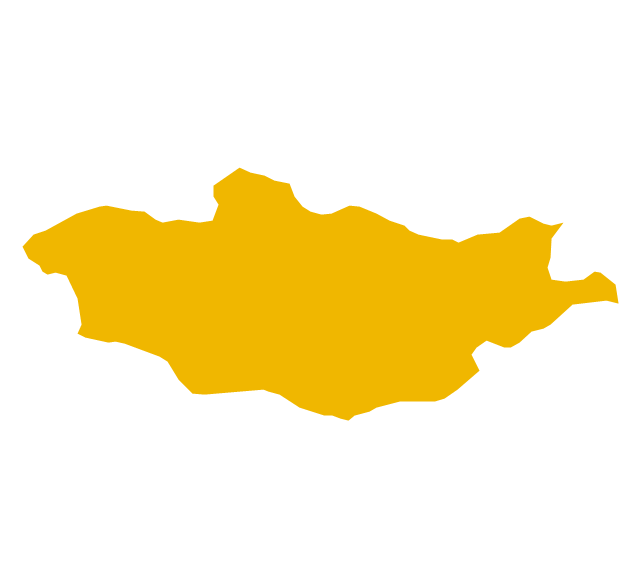
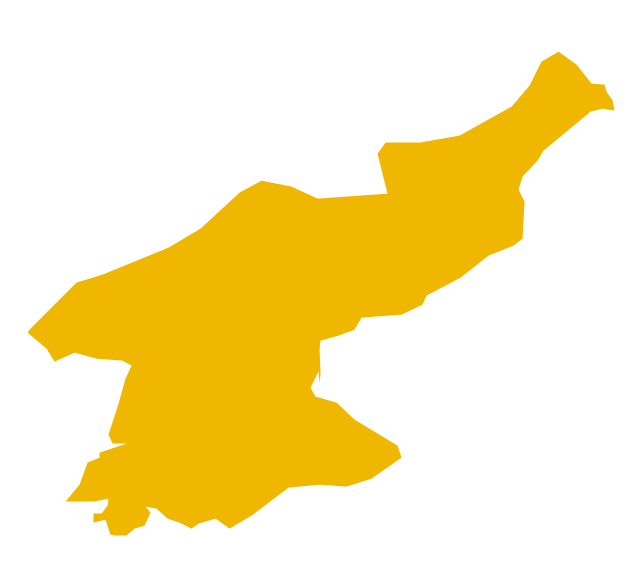
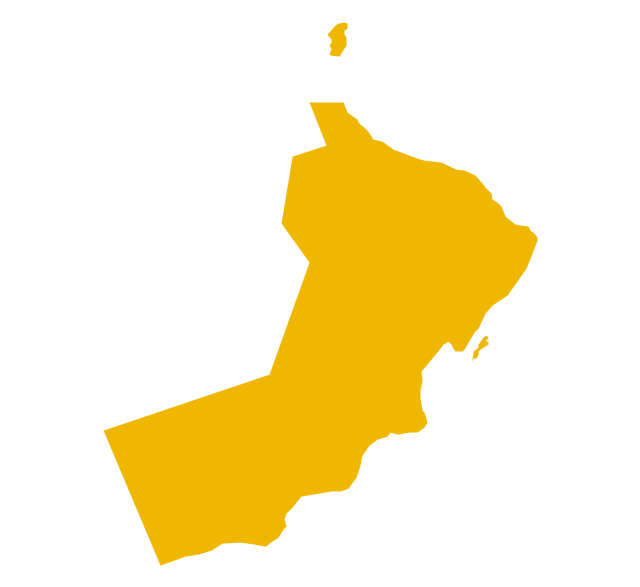
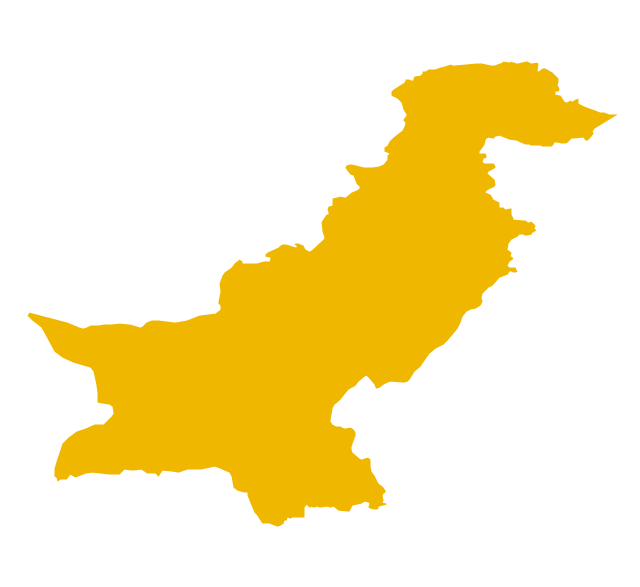
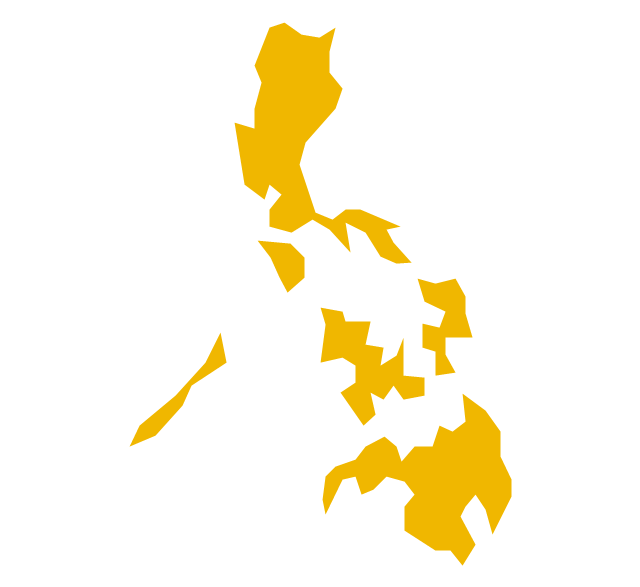
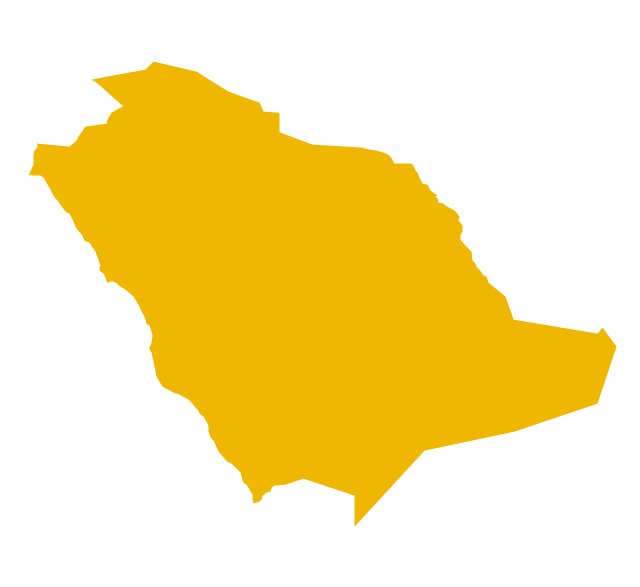
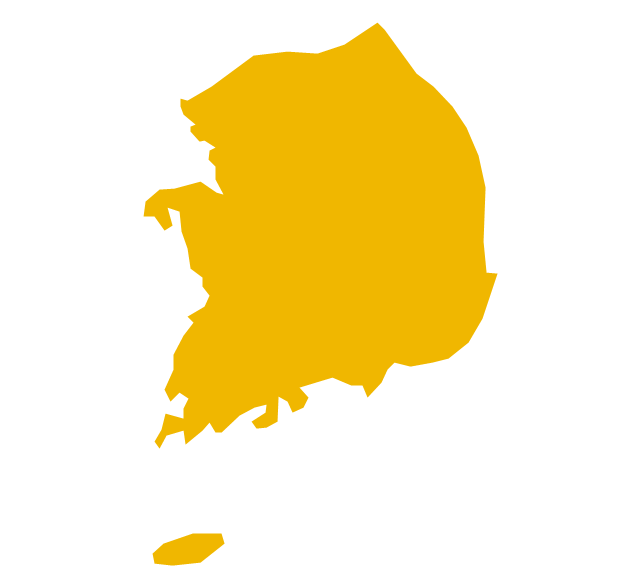
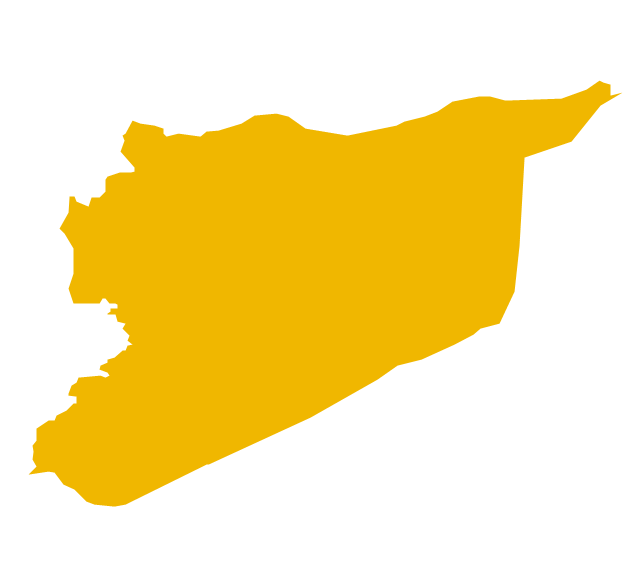
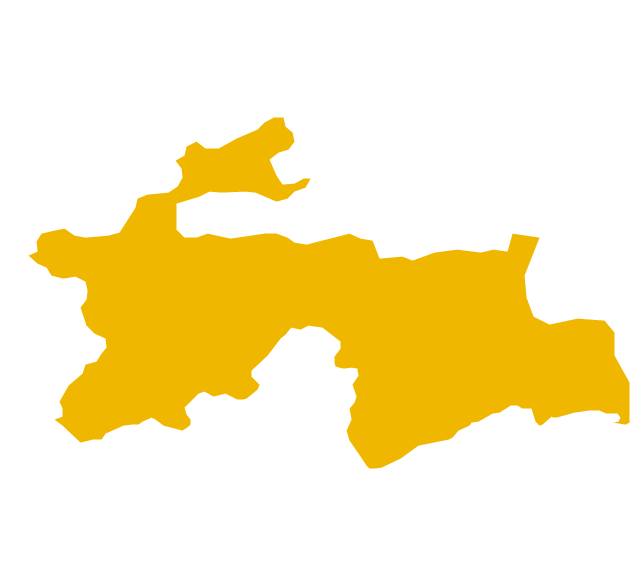
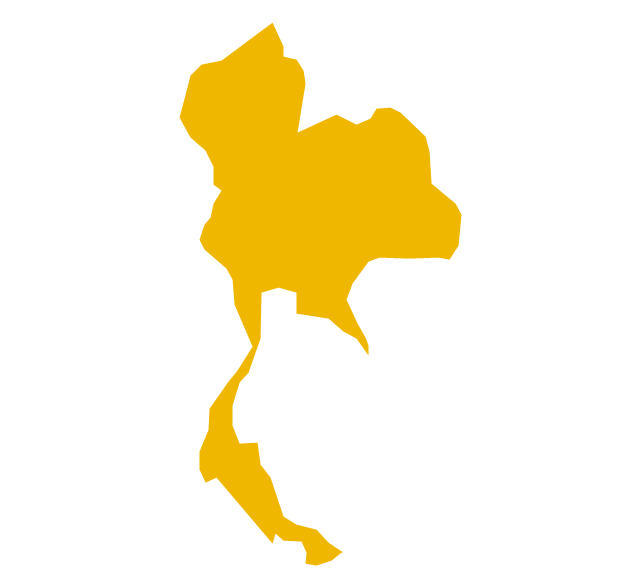
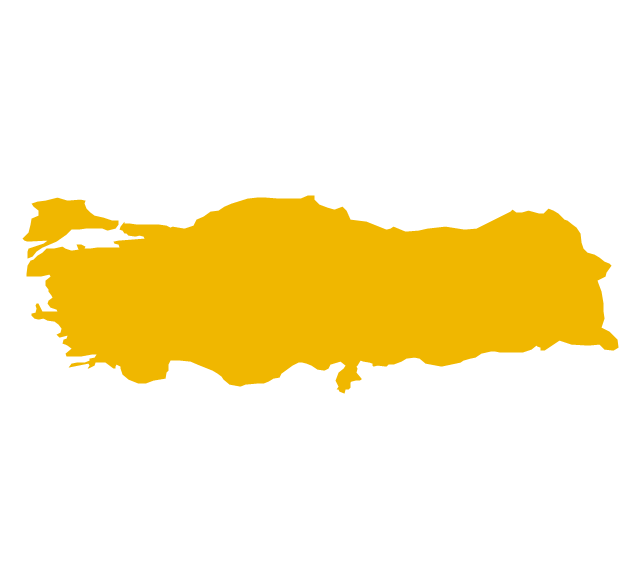
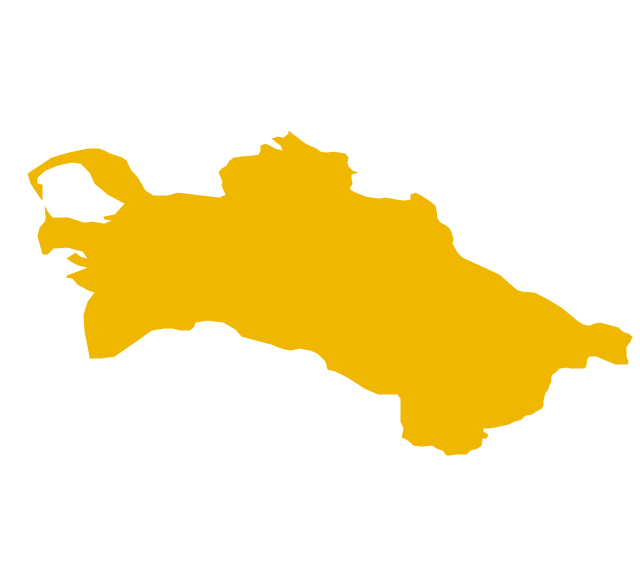
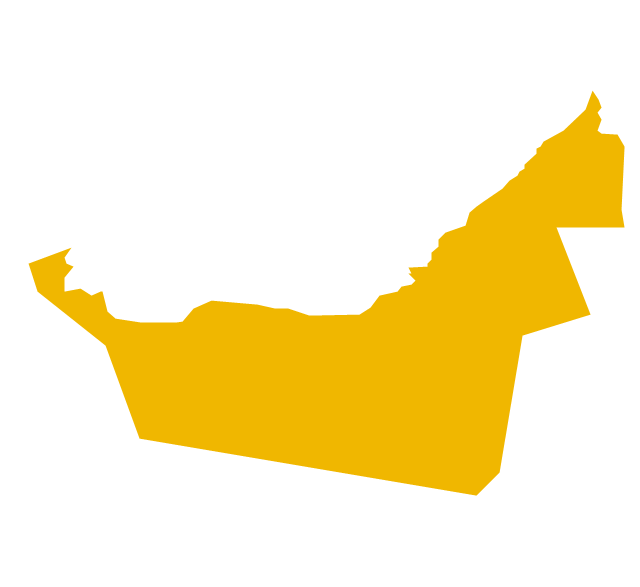
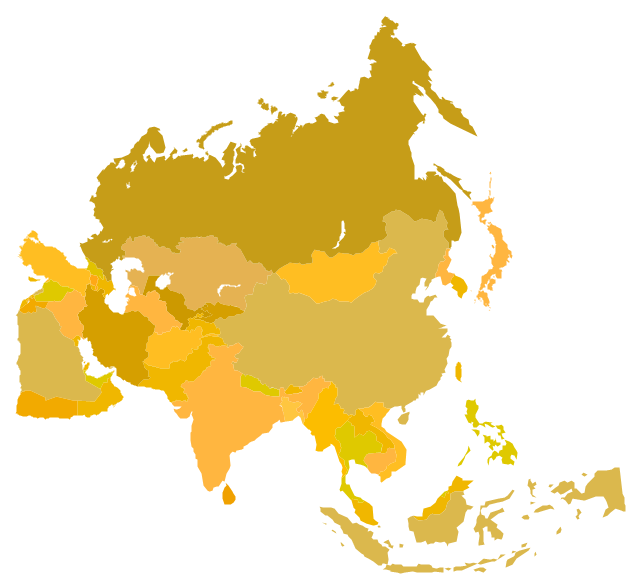
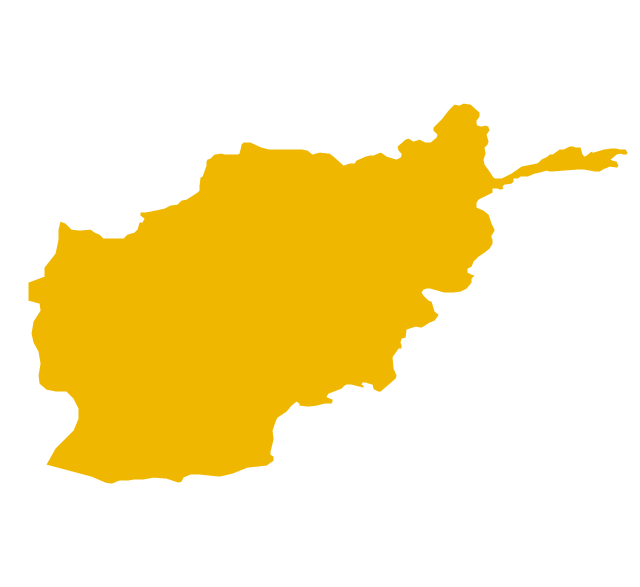
The vector stencils library "Asia" contains 47 country contours for drawing thematic maps of Asia.
Use it in your spatial infographics for visual representation of geospatial information, statistics and quantitative data in the ConceptDraw PRO diagramming and vector drawing software extended with the Spatial Infographics solution from the area "What is Infographics" of ConceptDraw Solution Park.
Use it in your spatial infographics for visual representation of geospatial information, statistics and quantitative data in the ConceptDraw PRO diagramming and vector drawing software extended with the Spatial Infographics solution from the area "What is Infographics" of ConceptDraw Solution Park.
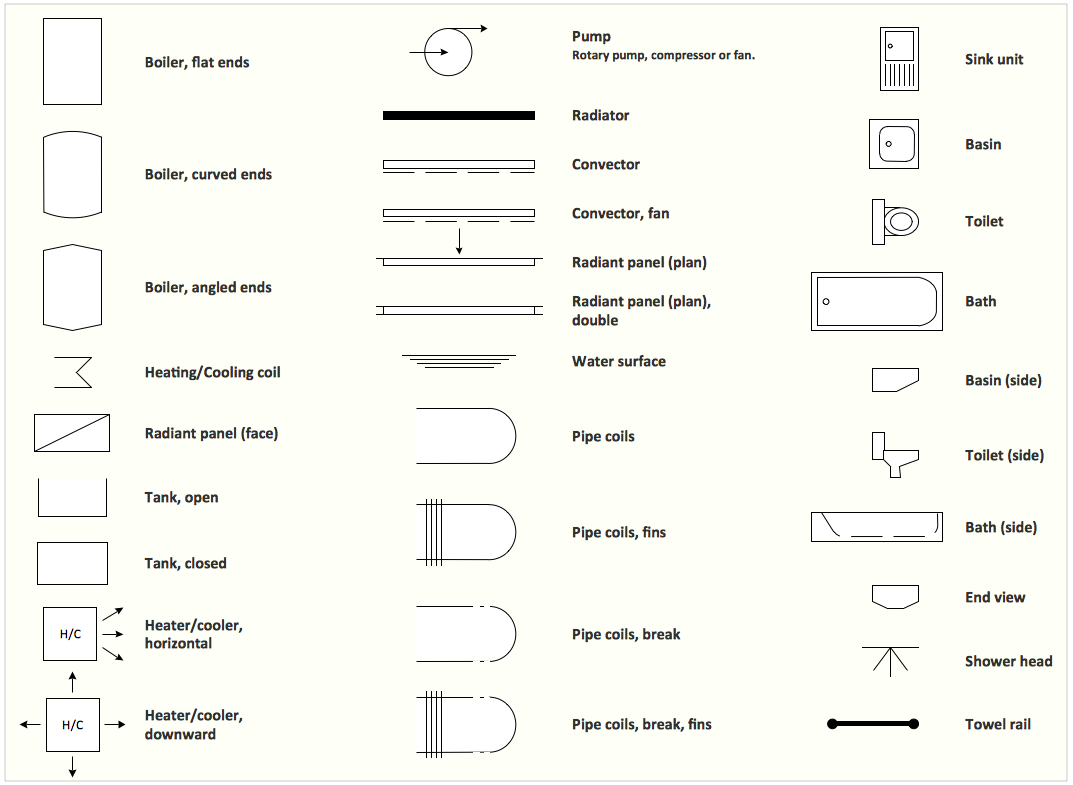
Interior Design. Plumbing — Design Elements
The plumbing system is a complex system of water supply pipes and drainpipes, sanitary equipment and drainage facilities, vent pipes and more. It supplies our homes, offices, hospitals, schools, business centers, and many other buildings with the main product for life - a water. For effective planning and montage the plumbing equipment, you need obligatory create and use different schematics of plumbing systems, the annotated plumbing diagrams, water lines and waste water plans. These diagrams are an obligatory part of any building project. They are used at all stages - construction, finishing works, interior design, and also during the exploitation of premises in cases of occurence some problems. Numerous libraries offered by the Plumbing and Piping Plans solution from Building Plans area of ConceptDraw Solution Park contain vector objects of plumbing components, sanitary equipment, bathroom fixtures, and many more for easy design the Plumbing and Piping plans, schematic diagrams and blueprints for hot and cold water supply systems, and waste water disposal systems.Radar Chart
This sample shows the Radar Chart that compares the internet dimensions in the four countries. The Radar Chart represents the multivariate data as a two-dimensional chart with three or more variables displayed on the axes that start in one point. The Radar Charts are used in the quality management, business, analytics and sport.Spider Chart Template
This sample shows the Spider Chart that represents the budget and spending for one organization and allows to compare them. The multivariate data are represented on the Spider Chart as a two-dimensional chart with four or more variables displayed on the axes that start in one point. The Spider Charts are used in the management, business and sport.- Asia - Vector stencils library | Nepal Map Sketch
- Asia - Vector stencils library | Vietnam Map Sketch
- Asia - Vector stencils library | Sketch Of Singapore Island
- How To Sketch Pakistan Map Step By Step
- Sketch Of Map Of South Asia Wikipedia
- Easy Sketch Philippine Map
- Map Of The Philippines Sketch In Easy Way
- Map Of The Philippines Basic Sketch
- South Asia - Political map | Continents Map | Geo Map - Asia | South ...
- Geo Map - Africa - Ethiopia | African country flags - Vector stencils ...
- Simple Map Singapore Malaysia
- Geo Map - Asia - Syria
- How To Draw South Korea Map
- How To Draw Pakistan Map Step By Step
- Geo Map - Asia - Mongolia | How To Create Restaurant Floor Plan in ...
- Geo Map - Asia - Syria | Asia - Vector stencils library | Geo Map ...
- Myanmar Map Step By Step Drawing
- Geo Map - Asia - Malaysia | Southeast Asia - Political map | Asia ...
- Geo Map - South America Continent | Map of Germany | Geo Map ...
- Geo Map - Asia - Yemen






-asia---vector-stencils-library.png--diagram-flowchart-example.png)
