This site uses cookies. By continuing to browse the ConceptDraw site you are agreeing to our Use of Site Cookies.

Marketing Flow Chart

ConceptDraw DIAGRAM diagramming and vector drawing software extended with Marketing Diagrams Solution from the Marketing Area of ConceptDraw Solution Park is the best software for quick and easy creating Marketing Flow Chart of any complexity and design. This charts created to define marketing project stages. In small business project management it sometimes generated by simple marketing project management software. Here is samples which included in Marketing Area of ConceptDraw Solution Park and it can be used as for project planning software as for project management report.

How to Collaborate in Business via Skype

Collaboration software for small and medium business allows communicate with partners around the globe via Skype.

Decision Making Software For Small Business

A software tool that saves your time on making decisions now has the ability to make decisions with remote team via Skype.

healthcare workflow diagram, healthcare workflow, healthcare workflow management, workflow analysis healthcare, clinical workflows in healthcare Healthcare Management Workflow Diagrams

healthcare workflow diagram, healthcare workflow, healthcare workflow management, workflow analysis healthcare, clinical workflows in healthcare
Healthcare Management Workflow Diagrams solution contains large set of colorful samples and libraries with predesigned vector pictograms and symbols of health, healthcare equipment, medical instruments, pharmaceutical tools, transport, medication, departments of healthcare organizations, the medical icons of people and human anatomy, flowchart objects, connectors, and arrows, which make it the best for designing clear and comprehensive Medical Workflow Diagrams and Block Diagrams, Healthcare Management Flowcharts and Infographics, Healthcare Workflow Diagram, for depicting the healthcare workflow and clinical workflows in healthcare, for making the workflow analysis healthcare and healthcare workflow management.

How To Create a Workflow Diagram

A workflow diagram is less general notation than a process flow diagram. Workflow as a term can apply to organizational process which involves people, resources, documents, sort of data, for instance; whereas a process is general collection of steps occuring in any sort of activity. That is why process flow diagram can be used as workflow diagram to describe business process, data flow or department interactions. The fastest way to create a workflow diagram is using pre-designed workflow template. ConceptDraw DIAGRAM with the Workflow Diagrams solution delivers rich set of workflow diagram templates you may start from.
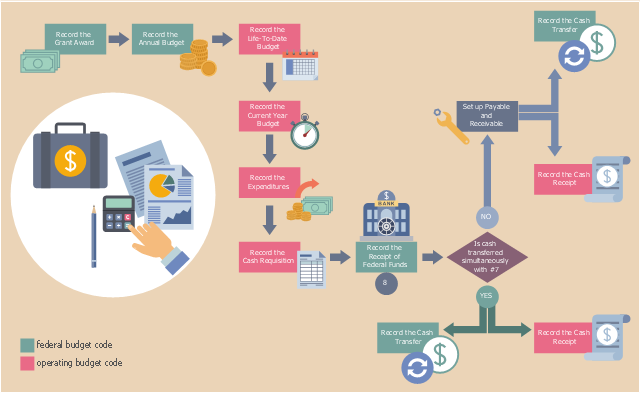
This example was designed on the base of the workflow diagram from the North Carolina Office of the State Controller website. [osc.nc.gov/ sigdocs/ sig_ docs/ documentation/ policies_ procedures/ flow.html]
"Grants are non-repayable funds or products disbursed by one party (grant makers), often a government department, corporation, foundation or trust, to a recipient, often (but not always) a nonprofit entity, educational institution, business or an individual. In order to receive a grant, some form of "Grant Writing" often referred to as either a proposal or an application is required. ...
Most grants are made to fund a specific project and require some level of compliance and reporting. The grant writing process involves an applicant submitting a proposal (or submission) to a potential funder, either on the applicant's own initiative or in response to a Request for Proposal from the funder. Other grants can be given to individuals, such as victims of natural disasters or individuals who seek to open a small business. Sometimes grant makers require grant seekers to have some form of tax-exempt status, be a registered nonprofit organization or a local government. ...
Project-related funding involving business, communities, and individuals is often arranged by application either in writing or online." [Grant (money). Wikipedia]
The workflow diagram example "Grant Accounting: business process flow" was created using ConceptDraw PRO software extended with the Business Process Workflow Diagrams solution from the Business Processes area of ConceptDraw Solution Park.
Workflow diagram
Workflow diagram, timer, sync, recycle, settings, script, process, pencil, on-page reference, invoice, investment, events calendar, dollar sign, decision, corner arrow, calculator, budget, banknotes, bank, arrow up, arrow right, arrow down, accounts payable, accounting,

Workflow Diagram Software Mac

ConceptDraw DIAGRAM software is the best Mac software for drawing workflow diagrams. Its rich set of samples and templates, and specific features to draw diagrams faster make this software as comfortable as possible for drawing workflow diagrams. Use the ConceptDraw DIAGRAM professional Mac OS X software for drawing workflow diagram. The Workflow Diagrams solution with its libraries and templates set make the possibility to identify resources that are required for work goal implementation. The process flow diagram identify flow which occurs as network of process dependencies, organizational decisions and interactions between departments. Usually workflow diagrams show business participants actions that carry product or service to the final destination, the consumer.

Business Graphics Software

ConceptDraw DIAGRAM business graphics software provides wide opportunities for creativity and helps generate amazing visuals by using the included drawing tools. Creatively designed graphics can communicate ideas and information more efficiently. Grow and improve your business and boost your brand awareness through appealing graphic design. Distinct and memorable visuals grab the attention of your audience efficiently. Create well-designed, attractive, and stylish graphical content with the Business Process Workflow Diagrams solution. The colorful graphics are pleasing to the eyes, impact positive first impression, and make reading the content more interesting. Highlight important things with colors or differentiated fonts.

Tool for Workgroup Briefings, Meetings and Decisions

A key point of conference success is the ability to see slides in real time, and hold documented discussions during the meeting. Remote Presentation for Skype is a new solution allows real-time presenting that benefits work groups who need collaborate by web meetings.

Data Flow Diagram (DFD)

A Data Flow Diagram (DFD) illustrates the flow of data through an information system, visualizes how the information is handled in terms of inputs and outputs, how the data enter to system and leave it. It is effective to use a Data Flow Diagram for creation the system's overview, to show the system's scope and boundaries. There are two different types of notations for DFDs: Yourdon-Coad and Gane-Sarson, which differ in visual representations for processes, data flow, data stores, external entities, etc. Thus, for example the processes are depicted as circles in Yourdon-Coad notation and as rounded squares in Gane-Sarson notation. Gane-Sarson notation is usually used for visualization information systems and Yourdon-Coad - for system analysis and design. The Data Flow Diagrams solution included to Software Development area of ConceptDraw Solution Park offers a lot of DFD templates, samples and examples, libraries of vector stencils for construction without efforts the DFDs according to both Gane-Sarson and Yourdon-Coad notations.

Flowchart Software

Flowchart is a simple diagram, map or graphical schematic representation the sequence of actions within a process. It is ideal for displaying how a process currently flows or can function ideally. The Flowcharts let define the steps and boundaries of a process, uncover problems or miscommunications. The Flowcharts are widely used in education, software development, business, economics, thanks to their visuality they are ideal for presentations, reports, for using on conferences to help the audience comprehend the content better, or easy find flaws in a process flow diagrams. ConceptDraw DIAGRAM is professional flowcharts software and feature-rich flowchart maker, which supports Mac OS X and Windows. It contains at ConceptDraw Solution Park a rich set of stencils and professional flowchart symbols for design. It lets create simply professional-looking Flowcharts based on thousand free flowchart templates, colored symbols and examples. ConceptDraw DIAGRAM is a 3 times cheaper alternative to MS Visio available for both Mac and PC. It’s is another full featured business and technical diagramming application that can easily take care of Visio files within OS X. Another bonus with ConceptDraw DIAGRAM – it's cross-platform. You can work on a document in both OS X and Windows, skipping Visio entirely.
How to Build a Flowchart

Emergency Plan

The Fire Emergency Plan illustrates the scheme of the building and location of the main and fire exits for a safe evacuation, and clearly defines directions to them on the plan. Fire Emergency Plans are constructed on the case of unexpected or emergency situations, fires, hazardous leaks, natural disasters, and other sudden events. They must to be obligatorily on the plain sight at every building and on each floor, at living houses and apartments, schools and universities, medical centers, clinics and hospitals, office buildings, banks, cafes, restaurants, and also at all other public buildings and institutions. The Evacuation plans and Emergency Plans preliminary designed in ConceptDraw DIAGRAM software help employees and family members when some emergency events happen and let avoid the accidents and sad consequences, prevent injuries and fatalities, allow reduce damages and speed the work resumption. Start drawing emergency blueprint from floor bounds, then add the inner walls and doors, and finally use bright arrows to visually show evacuation directions to fire exits. ConceptDraw is a serious alternative to Visio. It's a desktop based solution aimed at professional designers working in CAD environments. It is also a good option for those who work between Mac and PC because one license is valid for both.
How to Draw a Floor Plan

Organization Chart Software: A Comprehensive Guide

Create Organizational Chart Software - You need create Organizational Chart? Nothing could be easier with ConceptDraw DIAGRAM diagramming and vector drawing software. ConceptDraw DIAGRAM presents the Organizational Charts Solution from the Management Area that will allow you to draw the Organization Charts of any difficulty easy and quick.
How to draw an Organizational Chart

Flow chart Example
Warehouse Flowchart

Warehouse Flowcharts are various diagrams that describe the warehousing and inventory management processes on the warehouses. Typical purposes of Warehouse Flowcharts are evaluating warehouse performance, measuring efficiency of customer service and organizational performance. This type of Workflow diagrams can be used for identifying any disconnection between business activities and business objectives. They are effectively used by warehouse-related people and organizations, manufacturers, wholesalers, exporters, importers, transporters, and others. Standard Warehousing process flow diagram and standard Workflow diagram are used for process identification for further evaluating effectiveness and profitability of overall business process. Use the ConceptDraw DIAGRAM ector graphic software extended with Flowcharts solution to design your own professional-looking Workflow diagrams and Flowcharts of any types, including the Warehouse flowchart, Process flow diagrams which depict in details all steps of Warehouse packages flow. Microsoft Visio, designed for Windows users, can’t be opened directly on Mac. But fortunately, there are several Visio alternatives for Mac which will help Mac users to work Visio files. With ConceptDraw DIAGRAM , you may open, edit and save files in Visio format.
ConceptDraw Arrows10 Technology

Storage Design Software

ConceptDraw DIAGRAM provides the Plant Layout Plans solution from the Building Plans Area of ConceptDraw Solution Park to develop: Plant layouts for production, Storage, Distribution, Transport, Shipping, Receiving of manufactured goods.

Data Flow Diagram Model

Data Flow Diagram (DFD) is a technique of graphical structural analysis, describing the sources external to the system, recipients of data, also logical functions, data flows and data stores that are accessed. The DFD's goal is to show how each process converts its inputs into the outputs and to identify relationships between these processes, at this make the system's description clear and understandable at every level of detail. Historically happened that for describing Data Flow Diagrams are used two notations - Yourdon and Gane-Sarson that differ each from other by graphical representation of symbols. The DFD model, like most other structural models is a hierarchical model. Each process can be subjected to decomposition on the structural components, the relationships between which in the same notation can be shown on a separate diagram. Typically, several DFD models are built when modeling the system. ConceptDraw DIAGRAM software enhanced with Data Flow Diagrams solution ideally suits for creation DFD models and professional drawing Data Flow Diagrams.

Think and act effectively

Many people who use mind mapping software for personal organizing find ConceptDraw MINDMAP sufficiently useful mind mapping tool in their business and daily life. Especially many positive responses receive ConceptDraw MINDMAP as cross platform tool to mind maps for Macintosh and Windows.

Storage area networks (SAN). Computer and Network Examples

A Storage area network (SAN) is a dedicated network that provides access to data storage and operations only on the block level. SAN usually has own network of storage devices/elements and disk arrays that are connected with each other and to a remote data-sharing network. SANs are widely used for enhancing the storage devices (optical jukeboxes, disk arrays, tape libraries) that are accessible for networked servers. This example was created in ConceptDraw DIAGRAM using the Computer and Networks Area of ConceptDraw Solution Park. It shows the hybrid of Storage area network (SAN) and Network Attached Storage (NAS) technologies.

How to Simplify Flow Charting — Cross-functional Flowchart

In ConceptDraw DIAGRAM it really is sp simple to draw even the most complex cross-functional flowcharts. Use the RapidDraw technology and Cross-Functional libraries in ConceptDraw DIAGRAM for the best results.

What is a Quality Management

Successful quality management implemented in a company of any size is a critical component of a company organization.