Best Diagramming
Need to draw a diagram, process chart, flowchart, organizational chart, graphic design? ConceptDraw can help you to make professional graphic documents quickly.
HelpDesk
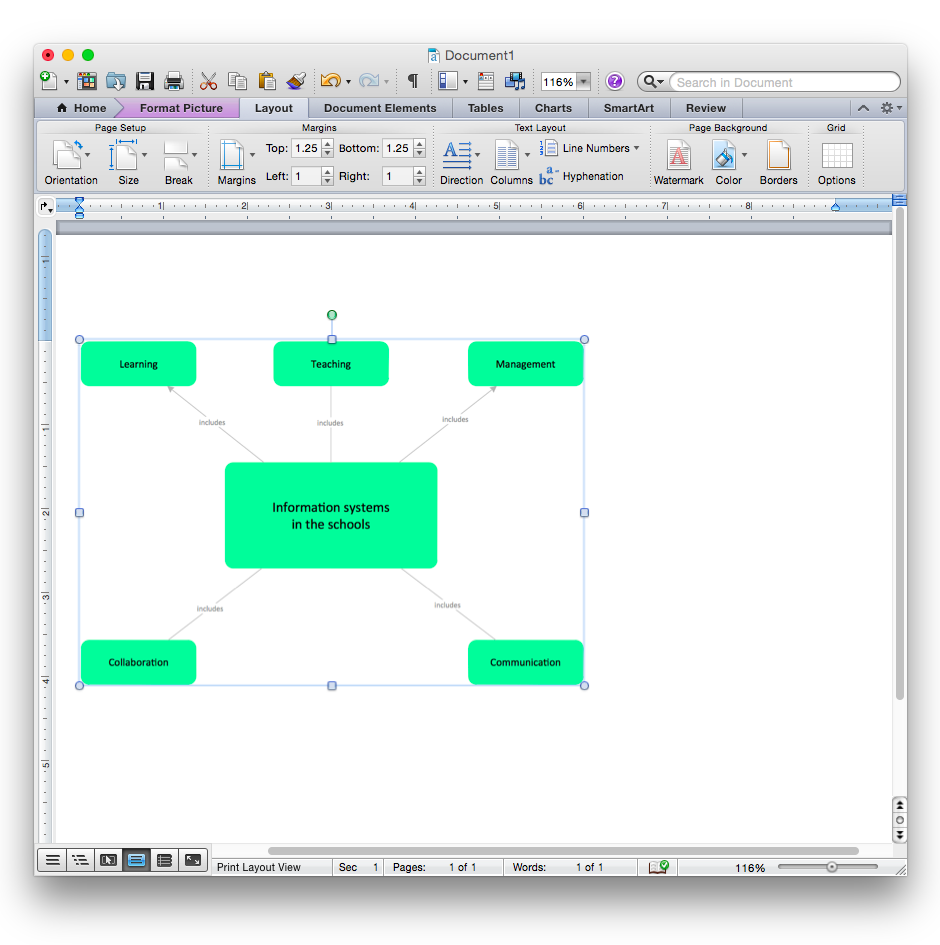
How to Add a Concept Map to a MS Word Document Using ConceptDraw PRO
ConceptDraw PRO allows you to easily create concept maps and then insert them into a MS Word document.HelpDesk
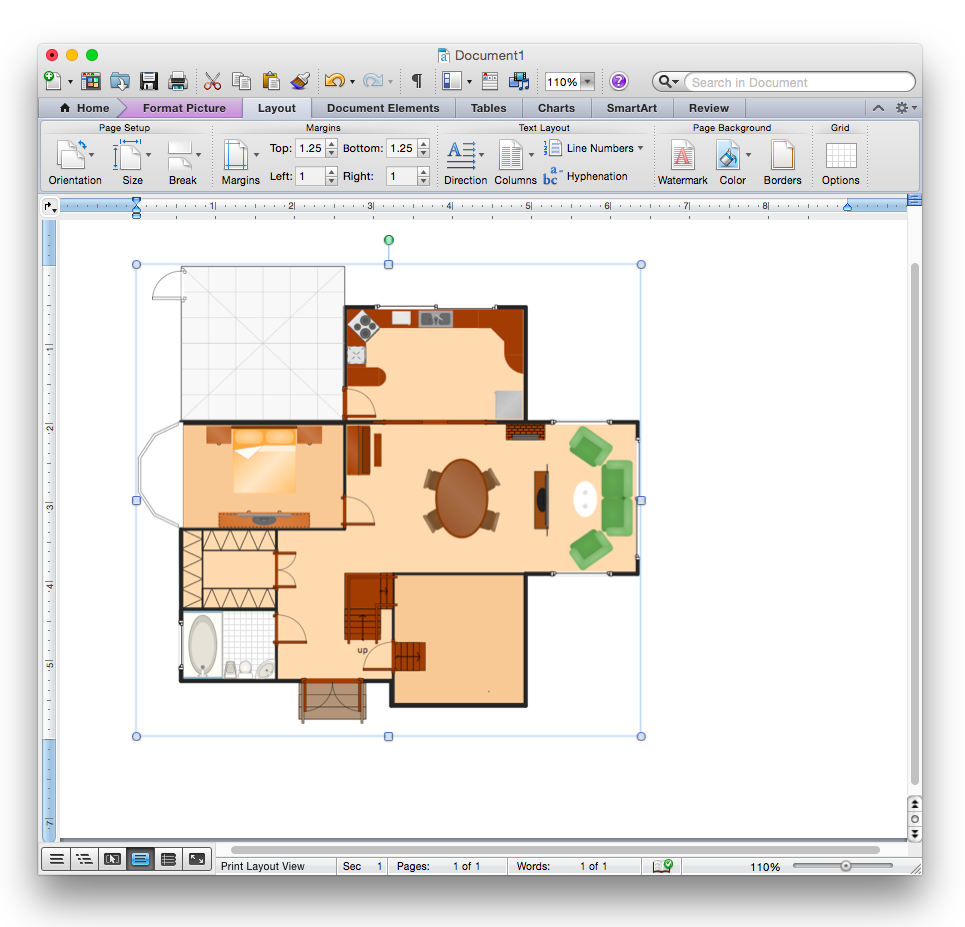
How to Add a Floor Plan to a MS Word Document Using ConceptDraw PRO
ConceptDraw PRO allows you to easily create floor plans of any complexity and then insert them into a MS Word document.Fishbone Diagram Template
A causal model is an abstract concept, that describes the causal mechanisms of a system, by noting certain variables and their influence on each other, in an effort to discover the cause of a certain problem or flaw. This model is presented in diagram form by using a fishbone diagram. ConceptDraw PRO diagramming and vector drawing software enhanced with Fishbone Diagrams solution helps you create business productivity diagrams from Fishbone diagram templates and examples, that provide to start using of the graphic method for the analysis of problem causes. Each predesigned Fishbone Diagram template is ready to use and useful for instantly drawing your own Fishbone Diagram.Pie Chart Word Template. Pie Chart Examples
The Pie Chart visualizes the data as the proportional parts of a whole and looks like a disk divided into sectors. The pie chart is type of graph, pie chart looks as circle devided into sectors. Pie Charts are widely used in the business, statistics, analytics, mass media. It’s very effective way of displaying relative sizes of parts, the proportion of the whole thing.Pie Chart
ConceptDraw PRO diagramming and vector drawing software offers the Pie Charts solution from the Graphs and Charts area of ConceptDraw Solution Park for quick and easy drawing the Pie Chart of any complexity.- Draw A Sketch Of System Development Cycle
- Pie Charts | Arrow circle chart - Template | Pie Chart Examples and ...
- Pie Chart Examples and Templates | Circular diagrams - Vector ...
- Circular Diagram Smart Art Shape
- Circle Spoke Diagram Template | 3 Circle Venn Diagram. Venn ...
- Circular Flow Diagram Template | Steps of Accounting Cycle | SWOT ...
- Circular Diagram | The Circular Flow Diagram | Daily Schedule ...
- Circle -Spoke Diagrams | Information Architecture | Target diagrams ...
- Circle -Spoke Diagrams
- Circle Diagrams | What Is a Circle Spoke Diagram | How To Convert ...
- Successful Strategic Plan | Strategic planning - Cycle diagram ...
- Donut Chart
- Line Chart Template for Word | Organization Chart Templates | Bar ...
- Circle Spoke Diagram Template | 3 Circle Venn Diagram. Venn ...
- Cross-Functional Flowchart | Examples of Flowcharts, Org Charts ...
- Pie Chart Examples and Templates
- How to Draw a Pie Chart Using ConceptDraw PRO | Pie Chart ...
- UML activity diagram - Cash withdrawal from ATM | UML Activity ...
- How to Add a Circle -Spoke Diagram to a MS Word Document Using ...
- Create Flow Chart on Mac | Best Diagramming | How To Create a ...


