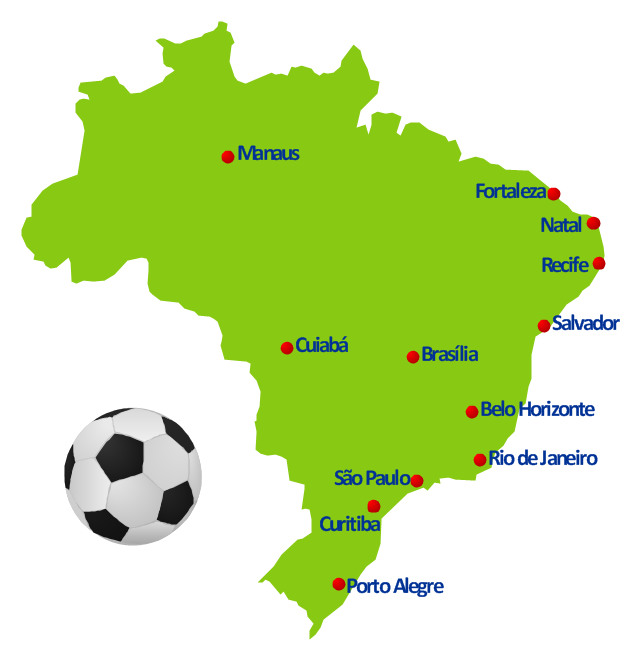
This spatial infographics example was created on the base of Brazil location map from the Wikipedia article "2014 FIFA World Cup". [en.wikipedia.org/ wiki/ 2014_ FIFA_ World_ Cup]
"The 2014 FIFA World Cup will be the 20th FIFA World Cup, an international men's football tournament that is scheduled to take place in Brazil from 12 June to 13 July 2014. ...
Eighteen locations were presented as potential World Cup host cities: Belém, Belo Horizonte, Brasília, Campo Grande, Cuiabá, Curitiba, Florianópolis, Fortaleza, Goiânia, Maceió, Manaus, Natal, Porto Alegre, Recife, Rio Branco, Rio de Janeiro, Salvador and São Paulo." [2014 FIFA World Cup. Wikipedia]
The geospatial infographics example "2014 FIFA World Cup - Brazil location map" was created using the ConceptDraw PRO diagramming and vector drawing software extended with the Soccer solution from the Sport area of ConceptDraw Solution Park.
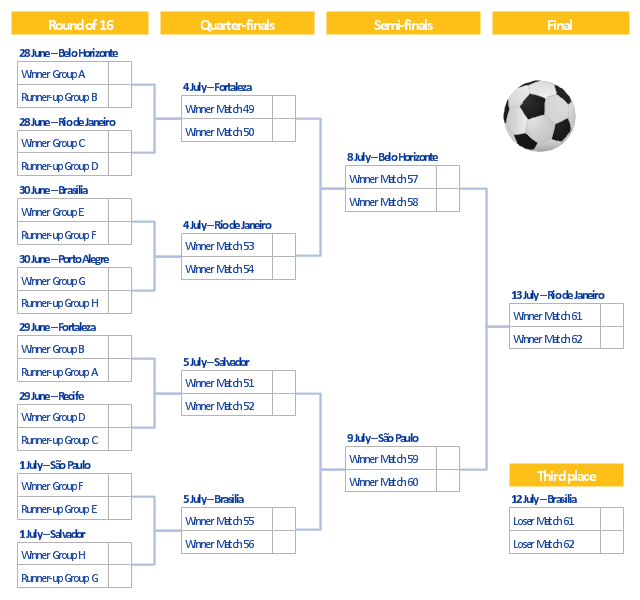
This example of a single-elimination tournament bracket was created on the base of the diagram from the Wikipedia article "2014 FIFA World Cup". [en.wikipedia.org/ wiki/ 2014_ FIFA_ World_ Cup]
"A single-elimination tournament - also called an Olympic system tournament, a knockout, single penetration, or sudden death tournament - is a type of elimination tournament where the loser of each bracket is immediately eliminated from winning the championship or first prize in the event.
This does not always mean that the defeated competitor will not participate further in the tournament; in some such tournaments, consolation or "classification" contests are subsequently held among those already defeated to determine the awarding of lesser places, for example, a third place playoff.
Where more than two competitors can play in each match, such as in a shootout poker tournament, players are removed when they can no longer play until one player remains from the group. This player moves on to the next round.
A simple way to describe a single-elimination tournament is that the winner of each match moves on and the loser fails to progress in the tournament.
Some competitions are held with a pure single-elimination tournament system. Others have many phases, with the last being a single-elimination final stage called playoffs." [Single-elimination tournament. Wikipedia]
The football (soccer) single-elimination tournament bracket diagram example "2014 FIFA World Cup - Knockout stage" was created using the ConceptDraw PRO diagramming and vector drawing software extended with the Soccer solution from the Sport area of ConceptDraw Solution Park.
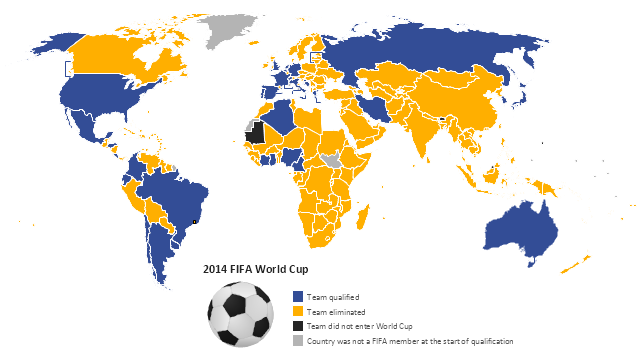
This football (soccer) spatial infographics example uses world thematic map to visualize status of countries with respect to 2014 FIFA World Cup: Team qualified, Team eliminated, Team did not enter World Cup, Country was not a FIFA member at the start of qualification.
This example was redesigned from the Wikimedia Commons file: 2014 world cup qualification.PNG. [commons.wikimedia.org/ wiki/ File:2014_ world_ cup_ qualification.PNG]
This file is licensed under the Creative Commons Attribution-Share Alike 3.0 Unported license. [creativecommons.org/ licenses/ by-sa/ 3.0/ deed.en]
The geospatial ingographic example "2014 FIFA World Cup qualification" was created using the ConceptDraw PRO diagramming and vector drawing software extended with the Soccer solution from the Sport area of ConceptDraw Solution Park.
www.conceptdraw.com/ solution-park/ sport-soccer
Cross-Functional Flowchart
Use of Cross-Functional Flowchart is a clear way of showing each team member’s responsibilities and how processes get shared or transferred between different responsible people, teams and departments. Use the best flowchart maker ConceptDraw DIAGRAM with a range of standardized cross-functional flowchart symbols to create the Cross-Functional Flowcharts simply and to visualize the relationship between a business process and the functional units responsible for that process. To draw the most quickly Cross-Functional Flowcharts, Cross Functional Process Maps, or Cross Functional Process Flow Diagrams, start with a Cross-functional flowchart samples and templates from ConceptDraw Solution Park. The ConceptDraw Arrows10 and RapidDraw technologies will be also useful for you in drawing. ConceptDraw DIAGRAM supports designing both types - horizontal and vertical Cross-functional flowcharts. A vertical layout makes the accents mainly on the functional units while a horizontal layout - on the process. If you need a Visio alternative in Mac OS X, try ConceptDraw DIAGRAM. Its interface is very intuitive and it’s actually much easier to use than Visio, yet somehow it’s just as powerful if not more so. ConceptDraw DIAGRAM performs professional quality work and seamless Visio interaction.
- 2014 FIFA World Cup
- 2014 FIFA World Cup - Standings - Group B
- Bathroom - Vector stencils library | 2014 FIFA World Cup - Brazil ...
- Football – 2014 FIFA World Cup Standings Group
- 2014 FIFA World Cup
- 2014 FIFA World Cup - Knockout stage | Soccer | Knockout Stage ...
- 2014 FIFA World Cup
- Brazil in South America - Political map | South America regions ...
- 2014 FIFA World Cup - Knockout stage | Seat blocks - Vector ...
- Spatial infographics Design Elements: Location Map | Design ...


