The vector stencils library "Sales KPIs and Metrics" contains 15 chart templates and graphic indicators of sales key performance indicators (KPIs) and metrics.
Use it for drawing sales dashboards in the ConceptDraw PRO diagramming and vector drawing software extended with the Sales Dashboard solution from the Marketing area of ConceptDraw Solution Park.
Use it for drawing sales dashboards in the ConceptDraw PRO diagramming and vector drawing software extended with the Sales Dashboard solution from the Marketing area of ConceptDraw Solution Park.
Actual vs Plan

Average Purchase Value

Clicks from Sales Follow-Up Emails

Cost per customer

Cost per order

Lead Response Time

Opportunity-to-Win Ratio

Product mix

Product Performance

Rate of Contact

Rate of Follow Up Contact

Sales Growth

Sales Target

Social Media Usage

Usage Rate of Marketing Collateral

The vector stencils library "Sales KPIs and Metrics" contains 15 chart templates and graphic indicators of sales key performance indicators (KPIs) and metrics for drawing sales dashboards: line charts "Cost per order" and "Clicks from Sales Follow-Up Emails", column charts "Social Media Usage" and "Usage Rate of Marketing Collateral", horizontal bar charts "Rate of Follow Up Contact", "Cost per customer" and "Lead Response Time", pie charts "Product mix", "Product Performance" and "Rate of Contact", gauge (speedometer) indicators "Sales Growth" and "Actual vs Plan", bullet indicator "Sales Target", diamond alarm indicators "Average Purchase Value", "Quote to Close Ratio", "Opportunity-to-Win Ratio" and "Sales Ratio".
The dashboard charts and indicators example "Design elements - Sales KPIs and metrics" for the ConceptDraw PRO diagramming and vector drawing software is included in the Sales Dashboard solution from the Marketing area of ConceptDraw Solution Park.
www.conceptdraw.com/ solution-park/ marketing-sales-dashboard
Sales dashboard charts and graphic indicators

Social Media Response DFD Flowcharts - diagramming software ( Mac PC )


How to Create a Social Media DFD Flowchart

UML Use Case Diagram Example. Social Networking Sites Project

Social Media Flowchart Symbols

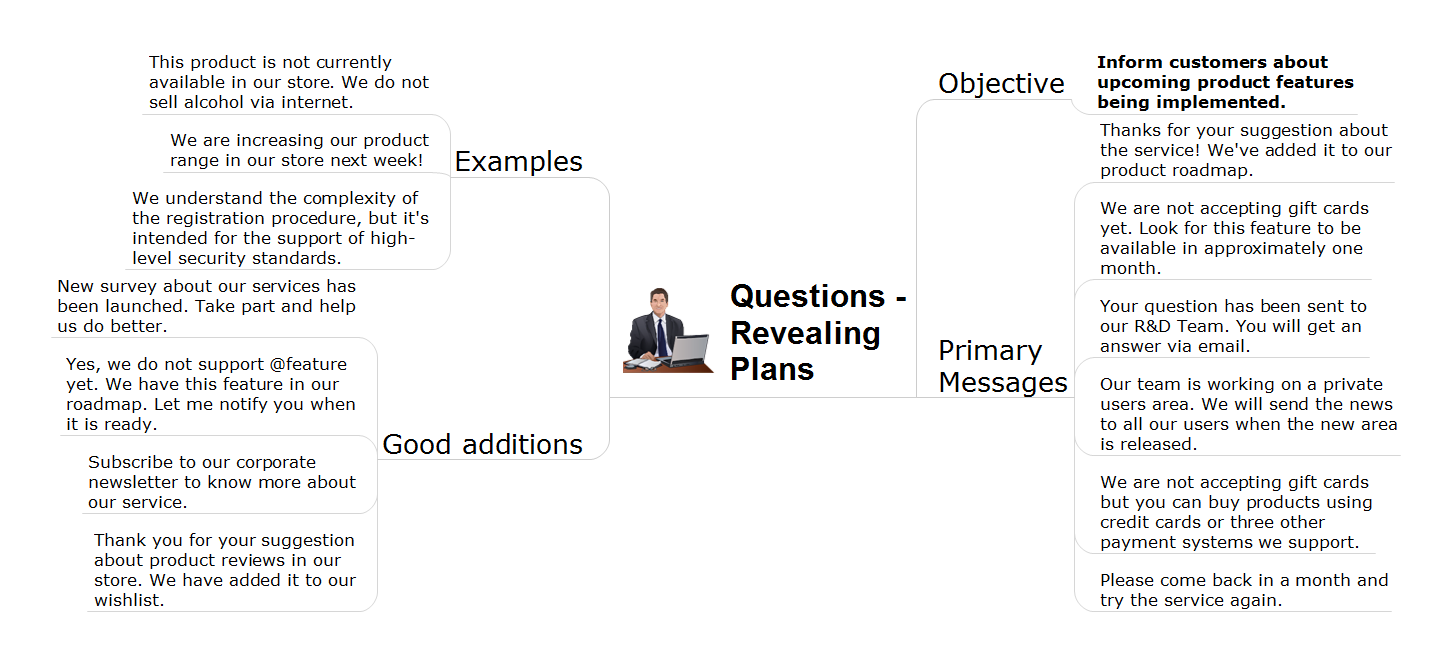
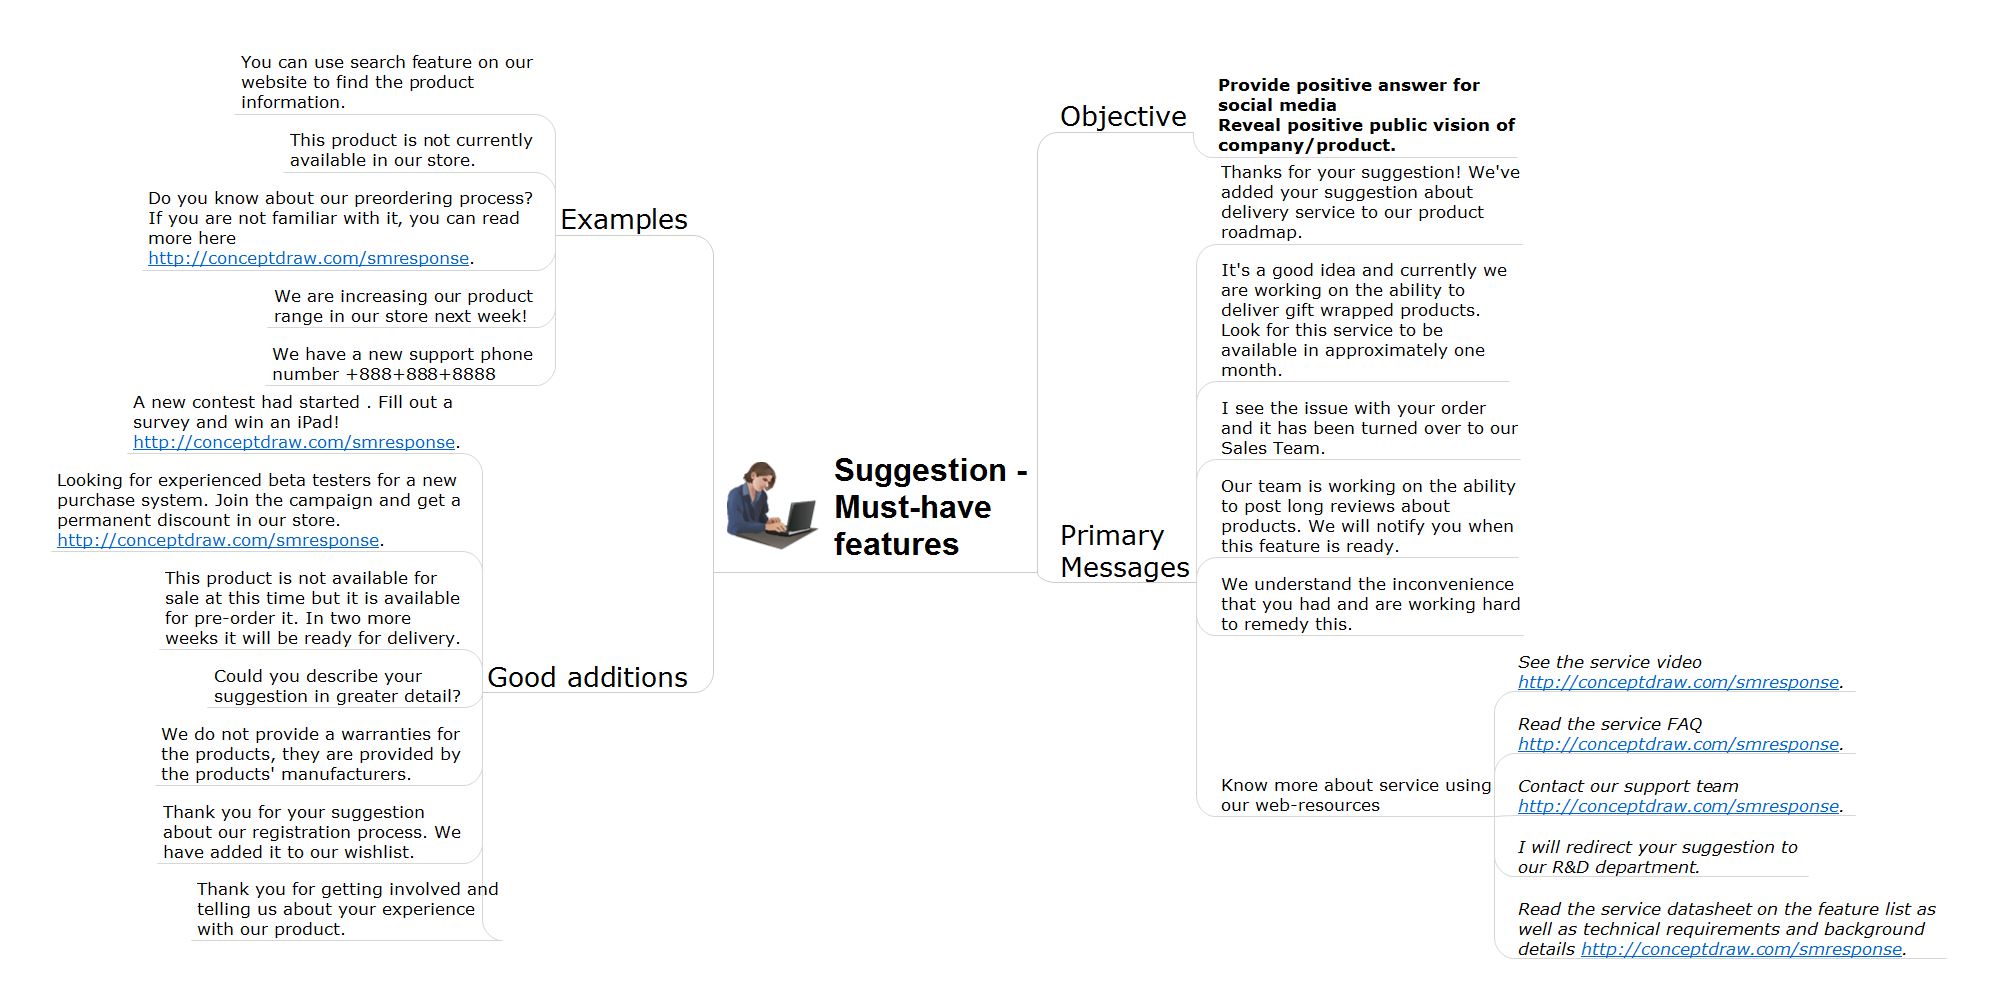
Manage Social Media Response Plan DFD

Social Media Response Management DFD Charts - software tools

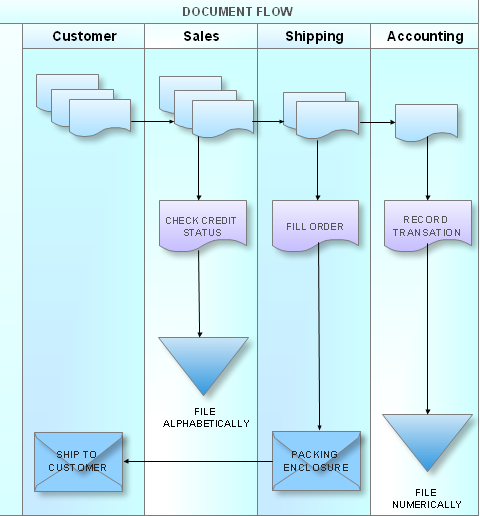
What is a Cross Functional Flow Chart?
Provide Team Training
How to Prepare Learning Presentations for Training
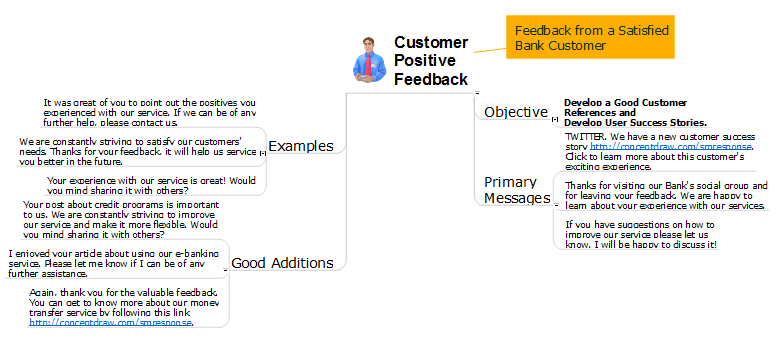
How to Present a Social Media Response Plan DFD to Your Team

The vector stencils library "Sales KPIs and Metrics" contains 15 chart templates and graphic indicators of sales key performance indicators (KPIs) and metrics.
Use it for drawing sales dashboards in the ConceptDraw PRO diagramming and vector drawing software extended with the Sales Dashboard solution from the Marketing area of ConceptDraw Solution Park.
Use it for drawing sales dashboards in the ConceptDraw PRO diagramming and vector drawing software extended with the Sales Dashboard solution from the Marketing area of ConceptDraw Solution Park.
Actual vs Plan
Average Purchase Value
Clicks from Sales Follow-Up Emails
Cost per customer
Cost per order
Lead Response Time
Opportunity-to-Win Ratio
Product mix
Product Performance
Rate of Contact
Rate of Follow Up Contact
Sales Growth
Sales Target
Social Media Usage
Usage Rate of Marketing Collateral
Waterfall Bar Chart

How to Present Workflow to Team
- Metrics Vector Png
- Business Productivity - Marketing | Marketing mix - Wheel diagram ...
- Sales Marketing Vector Png
- Step chart - Cloud testing steps | How to Create a Social Media DFD ...
- Marketing Png Vector
- Growth Of Indicators Png
- Sale Vector Png
- Chart Gauge Png
- Target diagrams - Vector stencils library | Target Diagram ...
- Order Vector Png
- Kpis Png
- Sales KPIs and Metrics - Vector stencils library | Design elements ...
- Sales Vectors Png
- Extended Growth Vector
- Social Media Response | Data Flow Diagram (DFD) | AWS Security ...
- Sales KPIs and Metrics - Vector stencils library | Sales Flowcharts ...
- Kpi Png
- Sales KPIs and Metrics - Vector stencils library | KPI Dashboard ...
- Contacts Vector Png
- Social Media Response | Venn Diagram Examples for Problem ...