The vector stencils library "Sales workflow" contains 39 sales workflow symbols.
Use these sales icon set to draw your sales flowcharts, workflow diagrams and process charts with the ConceptDraw PRO diagramming and vector drawing software.
The sales pictograms library "Sales workflow" is included in the Sales Flowcharts solution from the Marketing area of ConceptDraw Solution Park.
The vector stencils library "Sales KPIs and Metrics" contains 15 chart templates and graphic indicators of sales key performance indicators (KPIs) and metrics.
Use it for drawing sales dashboards in the ConceptDraw PRO diagramming and vector drawing software extended with the Sales Dashboard solution from the Marketing area of ConceptDraw Solution Park.
Use it for drawing sales dashboards in the ConceptDraw PRO diagramming and vector drawing software extended with the Sales Dashboard solution from the Marketing area of ConceptDraw Solution Park.
 Social Media Response
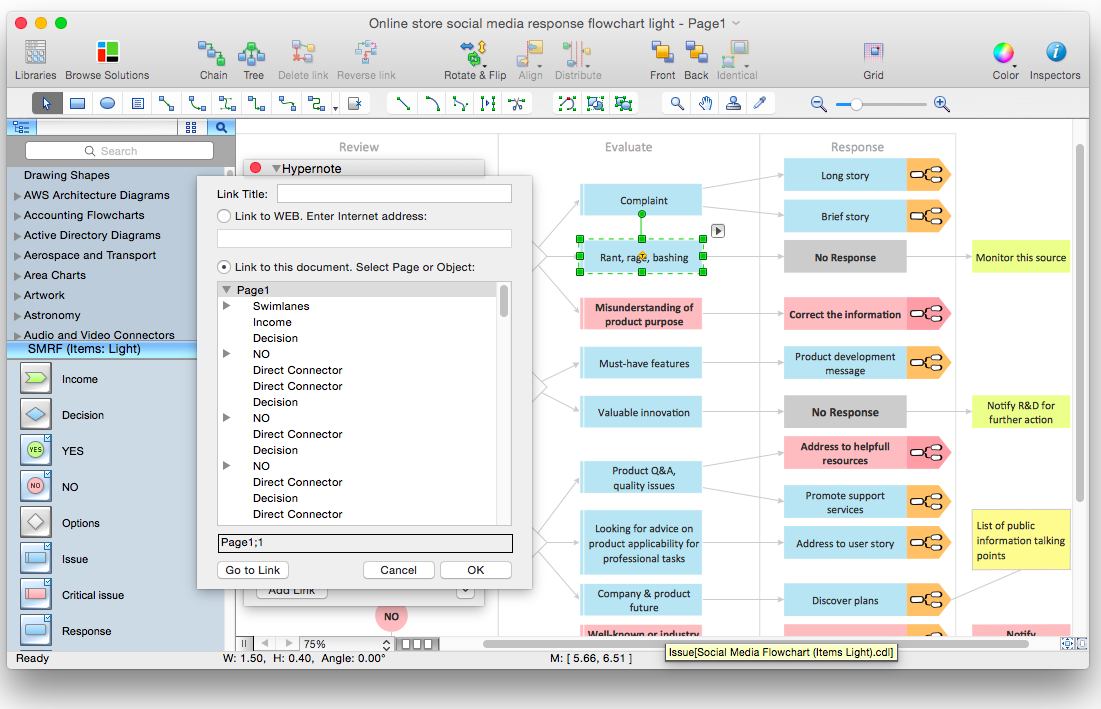
This solution extends ConceptDraw PRO and ConceptDraw MINDMAP with the ability to draw interactive flow charts with action mind map templates, to help create an effective response to applicable social media mentions.
The vector stencils library "Sales KPIs and Metrics" contains 15 chart templates and graphic indicators of sales key performance indicators (KPIs) and metrics for drawing sales dashboards: line charts "Cost per order" and "Clicks from Sales Follow-Up Emails", column charts "Social Media Usage" and "Usage Rate of Marketing Collateral", horizontal bar charts "Rate of Follow Up Contact", "Cost per customer" and "Lead Response Time", pie charts "Product mix", "Product Performance" and "Rate of Contact", gauge (speedometer) indicators "Sales Growth" and "Actual vs Plan", bullet indicator "Sales Target", diamond alarm indicators "Average Purchase Value", "Quote to Close Ratio", "Opportunity-to-Win Ratio" and "Sales Ratio".
The dashboard charts and indicators example "Design elements - Sales KPIs and metrics" for the ConceptDraw PRO diagramming and vector drawing software is included in the Sales Dashboard solution from the Marketing area of ConceptDraw Solution Park.
www.conceptdraw.com/ solution-park/ marketing-sales-dashboard
HelpDesk
How to Organize a Social Media Activity Using Social Media Response Solution
Tips on how to use flowcharting and mindmapping for social media activity organizing
 ConceptDraw Solution Park
ConceptDraw Solution Park collects graphic extensions, examples and learning materials
HelpDesk
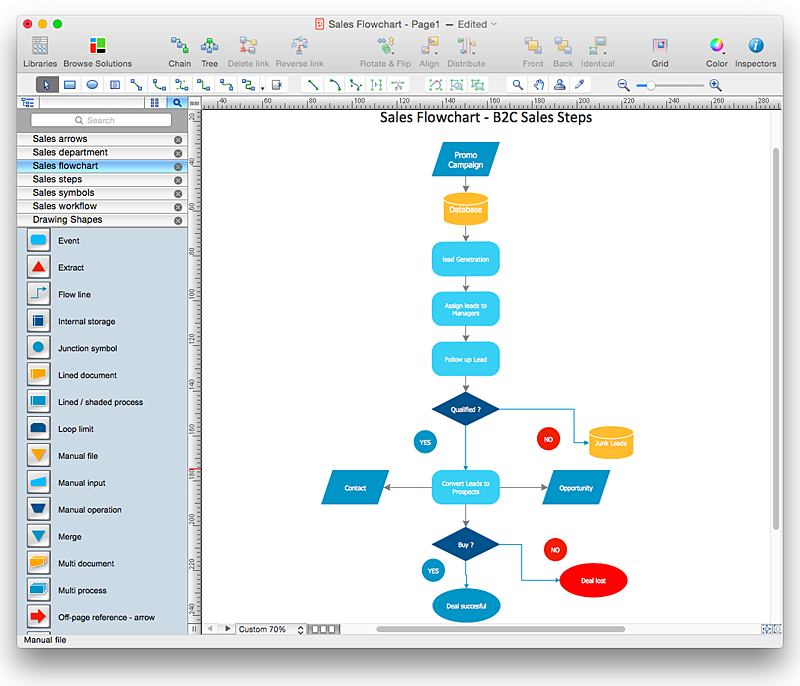
How to Create a Sales Flowchart Using ConceptDraw PRO
A Sales flowchart is a specialized type of flowchart. With the help of a sales flowchart you can visually describe tasks, documents, people responsible for execution at each stage of the sales process. For most commercial organizations, the sales process is inherent to its existence and ability to create profit. Although each company will achieve this aim in its own way, the core selling process remains similar throughout — a potential buyer or prospective customer exchanges money with an organization in return for goods or services. Despite this rather simplistic definition, there exists huge scope as to which approach is taken. Indeed, it is not uncommon for the sales division to be the largest within a corporate structure, employing a team of salespeople, analysts, and the sales managers, who are in charge of sales division operations.The practical applications of sales process flowcharts are numerous and wide ranging. At sales level, you might map the process of customer interact
 Sales Dashboard
Sales Dashboard solution extends ConceptDraw PRO software with templates, samples and library of vector stencils for drawing the visual dashboards of sale metrics and key performance indicators (KPI).
 Sales Dashboard
Sales Dashboard solution extends ConceptDraw PRO software with templates, samples and library of vector stencils for drawing the visual dashboards of sale metrics and key performance indicators (KPI).
- Flowchart Marketing Process. Flowchart Examples | Flowchart ...
- Product life cycle process - Flowchart | Sales Process Flowchart ...
- How to Create a Social Media DFD Flowchart | MindTweet | Sale ...
- Sales Process Flowchart. Flowchart Examples | How to Create a ...
- Sales Process Flowchart. Flowchart Examples | How to Create a ...
- How to Create a Social Media DFD Flowchart | Draw Flowcharts with ...
- Sales Process Flowchart. Flowchart Examples | Marketing and Sales ...
- Marketing | SWOT Analysis Solution - Strategy Tools | Sales Process ...
- Flow Chart of Marketing Analysis
- How to Create a Social Media DFD Flowchart | Online store social ...
- How to Create a Social Media DFD Flowchart | Flowchart Marketing ...
- How to Create a Social Media DFD Flowchart | Sales Flowcharts ...
- How to Create a Social Media DFD Flowchart | Venn diagram ...
- E-Filing general workflow | Sales Process Flowcharts | Online store ...
- Sales workflow - Vector stencils library
- Sales workflow - Vector stencils library
- How to Create a Social Media DFD Flowchart | Manage Social ...
- Online store social media response flowchart | Visual shopping ...
- Social Media Marketing Infographic
