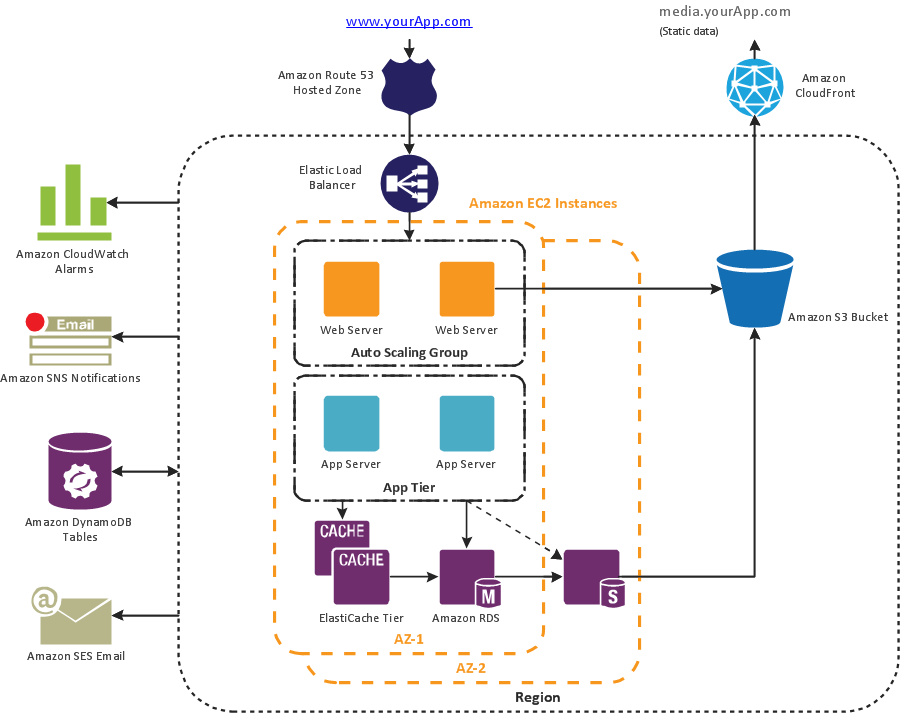
Software development with ConceptDraw products
Internet solutions on ConceptDraw base. What may interest developers of Internet solutions.Project —Task Trees and Dependencies
Users new to ConceptDraw PROJECT will find the Basic lessons an essential platform for familiarizing themselves with the program′s functions. This video lesson will teach you how to set up task trees and dependencies.Diagrama de Topologia
PRO is a powerful drawing tool that changes the way diagrams are produced. ConceptDraw Arrows10 Technology - This is more than enough versatility to draw any type of diagram with any degree of complexity. Diagrama de Topologia or Topology Diagram helps you see the big picture as you develop a service.HelpDesk
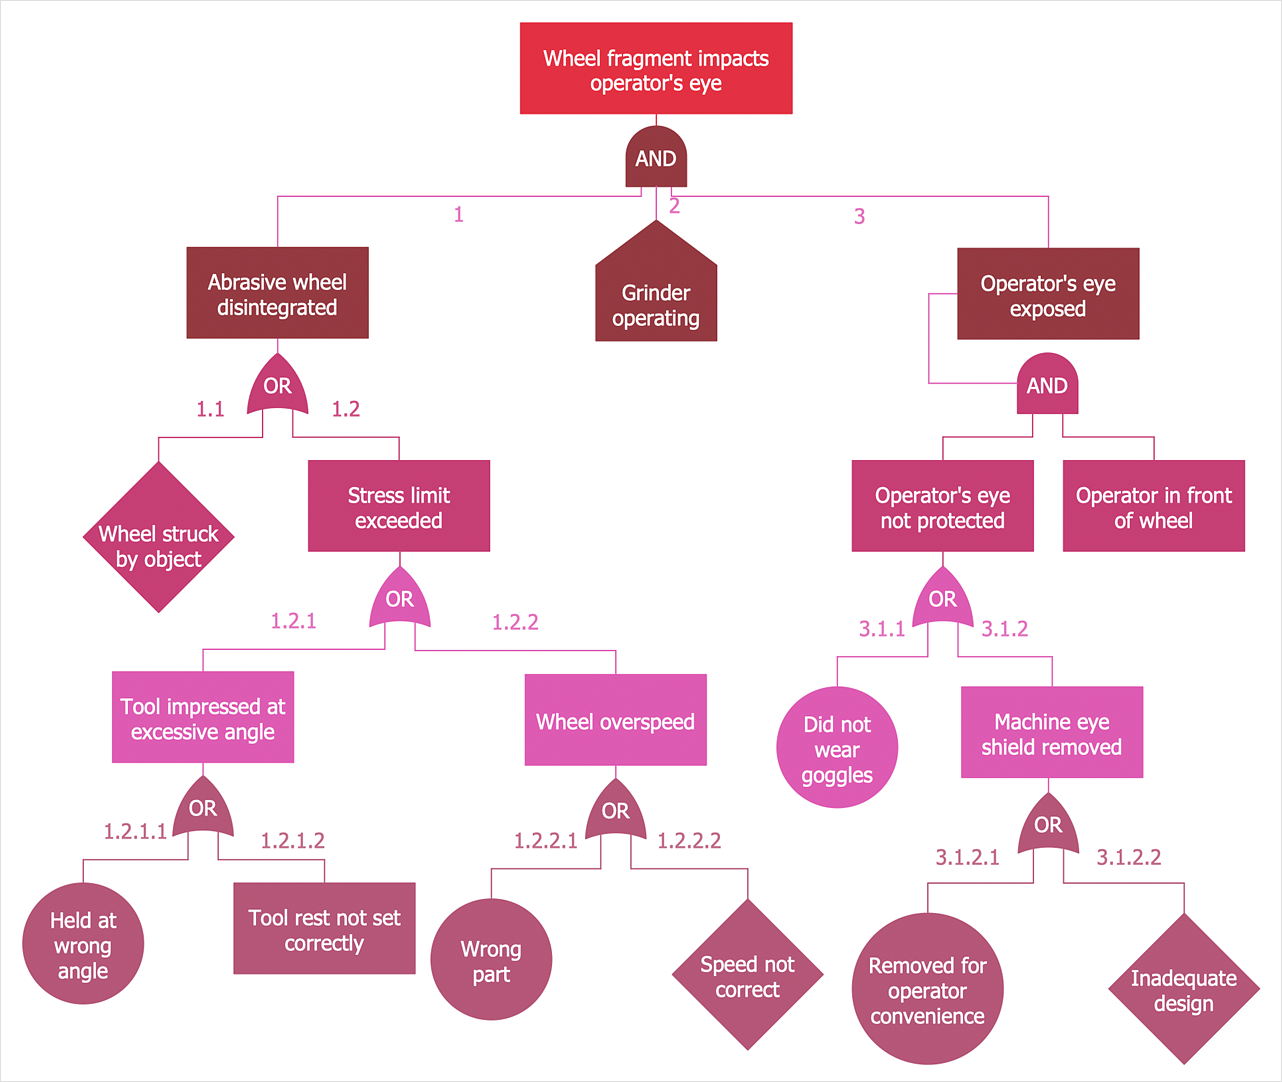
How to Create a Fault Tree Analysis Diagram (FTD)
Fault Tree Diagram is a logic diagram that shows the state of an entire system in a relationship of the conditions of its elements. Fault Tree Diagram is used to analyze the probability of functional system failures and safety accidents. ConceptDraw DIAGRAM allows you to create professional Fault Tree Diagrams using the basic FTD symbols. An FTD visualizes a model of the processes within a system that can lead to the unlikely event. A fault tree diagrams are created using standard logic symbols. The basic elements in a fault tree diagram are gates and events.Data structure diagram with ConceptDraw DIAGRAM
Data structure diagram (DSD) is intended for description of conceptual models of data (concepts and connections between them) in the graphic format for more obviousness. Data structure diagram includes entities description, connections between them and obligatory conditions and requirements which connect them. Create Data structure diagram with ConceptDraw DIAGRAM.Cross-Functional Process Map Template
When you need a drawing software to create a professional looking cross-functional charts, ConceptDraw with its Arrows10 Technology - is more than enough versatility to draw any type of diagram with any degree of complexity. Use templates with process maps, diagrams, charts to get the drawing in minutes.
 Fault Tree Analysis Diagrams
This solution extends ConceptDraw DIAGRAM.5 or later with templates, fault tree analysis example, samples and a library of vector design elements for drawing FTA diagrams (or negative analytical trees), cause and effect diagrams and fault tree diagrams.
ConceptDraw PROJECT Software Overview
ConceptDraw PROJECT is an effective tool for new and experienced users with a fine balance of usability and powerful functionality.Software development with ConceptDraw DIAGRAM
Modern software development requires creation of large amount of graphic documentation, these are the diagrams describing the work of applications in various notations and cuts, also GUI design and documentation on project management. ConceptDraw DIAGRAM technical and business graphics application possesses powerful tools for software development and designing technical documentation for object-oriented projects. Solutions included to the Software Development area of ConceptDraw Solution Park provide the specialists with possibility easily and quickly create graphic documentation. They deliver effective help in drawing thanks to the included package of templates, samples, examples, and libraries with numerous ready-to-use vector objects that allow easily design class hierarchies, object hierarchies, visual object-oriented designs, flowcharts, GUI designs, database designs, visualize the data with use of the most popular notations, including the UML and Booch notations, easy manage the development projects, automate projection and development.- Website Development Decision Tree
- Writebn Of Tree Diagram Flow Chart Diagram
- Process Flowchart | Software development with ConceptDraw PRO ...
- Tree Diagram Of Hierarchical Database Model In Accountancy
- Project —Task Trees and Dependencies | Basic Flowchart Symbols ...
- Decision Tree Template Visio
- Project —Task Trees and Dependencies | Data structure diagram ...
- Software Diagram Templates | UML package diagram - Template ...
- Data Flow Diagrams | Design elements - Fault tree analysis ...
- Influence Diagram Software | Workflow Diagram | Risk diagram ...
- Root cause analysis tree diagram
- Accident analytic tree - FTA diagram | Fault Tree Analysis Diagrams ...
- Decision Tree In Software Engineering With Example
- Process Flowchart | Basic Flowchart Symbols and Meaning | Project ...
- Project — Assigning Resources | Project —Task Trees and ...
- Project —Task Trees and Dependencies | | Project — Assigning ...
- Draw The Tree Structure Of Memory And Describe It With Example
- Program to Make Flow Chart | Software Development
- Tree Network Topology Diagram | How to Deliver a Presentation on ...
- Process Flowchart | Project —Task Trees and Dependencies | Flow ...


