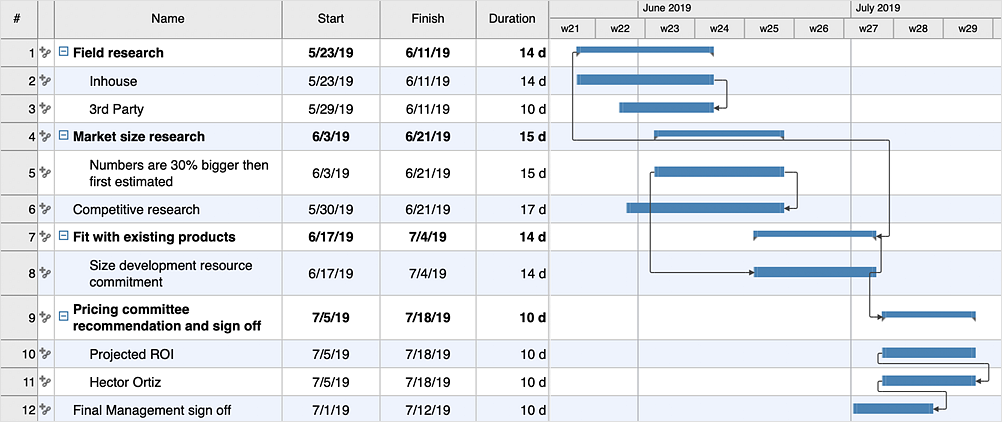
Gantt charts for planning and scheduling projects
ConceptDraw PROJECT is an excellent simple project scheduling software. It maintain classic project gantt charts and the line of professional reports on resources usage. It include handy critical path scheduling software tools and diagraming tools which helps prepare the presentation of project status. It include project tracking dashboard to keep project metrics upto date, also it have handy feature to export project management dashboard in excel file.HelpDesk
How to Create a Gantt Chart for Your Project
Instruction on how to create Gantt chart using ConceptDraw PROJECT software. Gant Chart is a graphical representation of tasks as segments on a time scale. It helps plan or overlapping.How To Create Project Report
ConceptDraw PROJECT contains an extensive tool set to help project managers. The rich data visualization capability that is provided by ConceptDraw products helps you create project dashboards, one-click reports, multi-project views, Gantt charts, and resource views. Let′s learn how to get maximum value using ConceptDraw PROJECT!Software development with ConceptDraw DIAGRAM
Modern software development requires creation of large amount of graphic documentation, these are the diagrams describing the work of applications in various notations and cuts, also GUI design and documentation on project management. ConceptDraw DIAGRAM technical and business graphics application possesses powerful tools for software development and designing technical documentation for object-oriented projects. Solutions included to the Software Development area of ConceptDraw Solution Park provide the specialists with possibility easily and quickly create graphic documentation. They deliver effective help in drawing thanks to the included package of templates, samples, examples, and libraries with numerous ready-to-use vector objects that allow easily design class hierarchies, object hierarchies, visual object-oriented designs, flowcharts, GUI designs, database designs, visualize the data with use of the most popular notations, including the UML and Booch notations, easy manage the development projects, automate projection and development.Chore charts with ConceptDraw DIAGRAM
Chore chart. Draw perfect-looking chore chart. Free chore chart samples. All about chore charts.- Gantt Chart For Software Development Sample
- Gantt Chart For Software Development Example
- Software development with ConceptDraw PRO | Gantt charts for ...
- Gantt chart examples | Booch OOD Diagram | IDEF0 Diagram | Gantt ...
- Example Gantt Chart For Software Development
- Sample Gantt Chart For Software Development Project
- Gantt Chart Software | Seating Chart Template | Project — Assigning ...
- Samples Of Software Development Gantt Chart
- A Sample System Of Ghant Chart As A Software Development Method
- Gantt Chart For Software Project Development
- Software Development Gantt Chart Example
- Gantt Chart Software Development Example
- Project Plan Software Development Example
- Gantt chart examples | Gant Chart in Project Management | How to ...
- Gantt Chart Example For Engineering Project
- Example Of Gantt Chart For System Development
- Gantt Chart Software
- Gantt Chart Making Software
- How to Report Task's Execution with Gantt Chart | Gant Chart in ...
- Project Timeline | Gant Chart in Project Management | How To ...


