Entity Relationship Diagram Software Engineering
Entity Relationship Diagram (aka ER Diagram, E-R Diagram, ERD) is a time-tested and widespread software development and software engineering method for data modeling, illustrating the logical structure of databases and system design. For ERDs construction are used three basic elements: entities, attributes, and relationships. Chen's notation for ERD supposes the use of rectangles (boxes) to represent entities and diamonds to depict relationships between first-class objects. This notation is popular when creating conceptual data models of information systems. Another standardized notation for ER diagrams is Crow's foot notation. ConceptDraw DIAGRAM as a powerful Entity Relationship Diagram software engineering provides the tools of Entity-Relationship Diagram (ERD) solution from Software Development area of ConceptDraw Solution Park for instantly describing databases using ERDs of Crow’s Foot and Chen’s notations. Use the predesigned vector elements for both these notations from 2 libraries included to Entity-Relationship Diagram (ERD) solution.UML Sample Project
Unified Modeling Language (UML) is a graphical modeling language for describing, visualizing, projecting and documenting of object oriented systems. UML digram is used for modeling of organizations and their business processes, for development the big projects, the complex software applications. Comprehensive UML diagram allows to create the set of interrelated documents that gives the complete visual representation of the modeling system.Home Architect Software. Home Plan Examples
Everyone who starts the construction, repair or remodeling of the home, flat or office, is facing with a need of visualization its ideas for visual explanation how all should to be for the foreman and construction team. It is incredibly convenient to use for this professional home architect software. ConceptDraw DIAGRAM software enhanced with Floor Plans solution provides a lot of built-in drawing tools which allow you quick and easy create design plans for the home of your dreams.Graphical User Interface Examples
ConceptDraw DIAGRAM extended with Windows 8 User Interface solution from the Software Development area is the best gui software. Using the drawing tools, libraries of vector objects, graphical user interface examples that offers Windows 8 User Interface solution, you will easily design the Windows 8 user interfaces and Windows 8 UI design patterns of any complexity.Data Flow Diagram Examples
Data flow diagrams (DFDs) are effective to reveal relationships among the various components in a program or system. This type of diagrams is an important and useful technique for modeling an information system, its process aspects, for showing a system as a single high-level process. DFD lets illustrate the flow of data, how the input data are transformed to output results across the sequence of functional transformations. DFD consists of four major components: entities, processes, data stores, data flows. When you need to draw a Data Flow Diagram the ConceptDraw DIAGRAM diagramming and vector drawing software extended with Data Flow Diagrams solution will be helpful for you. Providing numerous collection of Data Flow Diagram examples, samples, templates and ready-to-use vector DFD symbols, Data Flow Diagrams solution ensures you with all needed tools for easy designing DFDs according to Gane-Sarson or Yourdon-Coad notation on your choice. Any from offered predesigned DFD examples can become a perfect base for your own diagram.Computer Network Architecture. Computer and Network Examples
The network architecture and design specialization will help you gain the technical leadership skills you need to design and implement high-quality networks that support business needs.
Interior Design. Site Plan — Design Elements
Site plans are large scale drawings that illustrate a lot of useful information, such as location of buildings on the surrounding territories, topography of the site, roads, footpaths, paved and hardstandings areas, ramps, parking areas, fencing, walls and gates, landscape elements, trees and plants, layout of external lighting and service runs, adjoining and adjacent structures, surrounding streets, and many other details. On each Site plan are also designated the scale, dimensions, site boundaries, key materials, and other additional notes. 
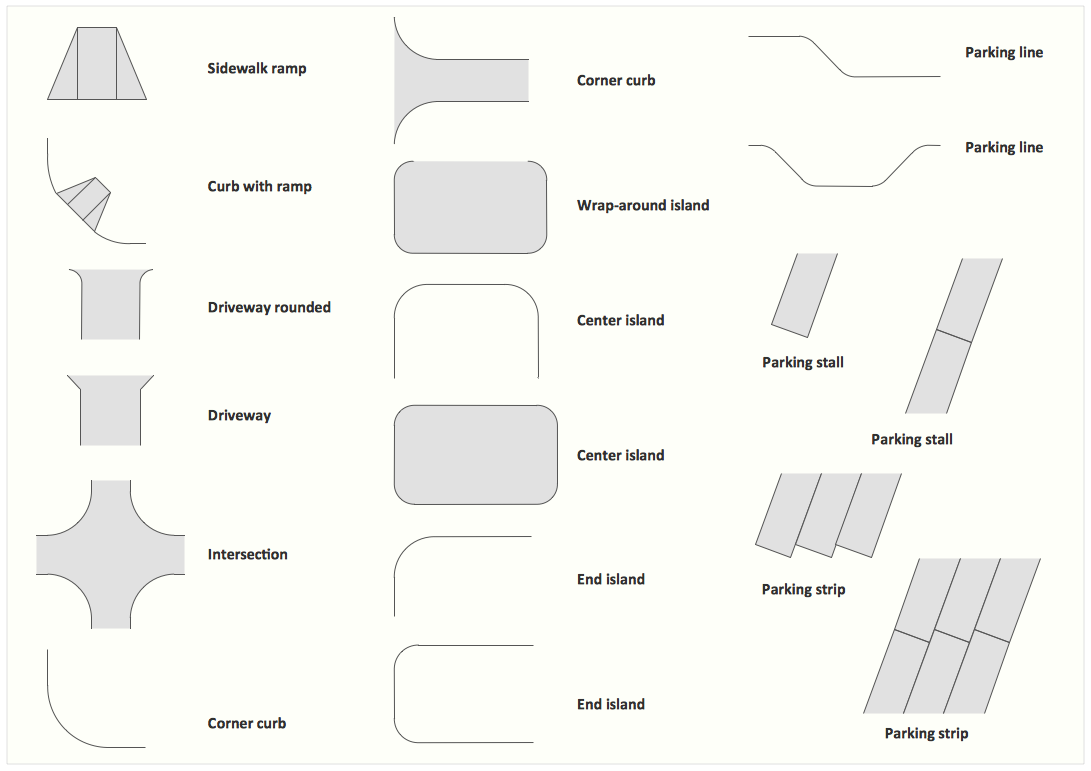
ConceptDraw DIAGRAM diagramming and interior design software extended with Site Plans solution from Building Plans area contains Parking and Roads, Site Accessories, Trees and Plants libraries with numerous collection of ready-to-use vector design elements for drawing detailed Site plans, Site design plans, Structural site plans, Landscape drawings for any locality and of any complexity without efforts. This software will be also useful for planning the parks, creation yard layouts, development residential and commercial landscape designs.Sample Project Flowchart. Flowchart Examples
This sample shows the Flowchart that displays the architecture of SQL Exception Translation. This sample was created in ConceptDraw DIAGRAM diagramming and vector drawing software using the Flowcharts solution from the Diagrams area of ConceptDraw Solution Park.
Diagramming Software for Design UML Package Diagrams
UML Package Diagram illustrates the functionality of a software system.
- Software Engineering Projects Examples Free Download
- Gantt Chart Example For Engineering Project
- Timeline Chart In Software Engineering
- Gantt Chart And Pert Chart In Software Engineering With Example
- Dfd Examples Software Engineering
- Software Engineering Project On Online Shopping Pdf Activity
- Ready Made Software Engineering Projects
- Project Scheduling Using Pert And Gantt Chart In Software
- Example Of Pert Chart In Software Engineering