This site uses cookies. By continuing to browse the ConceptDraw site you are agreeing to our Use of Site Cookies.
HelpDesk

How to Brainstorm with ConceptDraw MINDMAP

Brainstorming is a way of generating ideas related to a specific theme. Usually brainstorming involves a group of people generating a lot of ideas in a short period of time. The key to brainstorming is putting off the process of evaluating ideas until a later stage. The participants keep a record of their ideas as they come to mind, without thinking them over. Unorthodox and unusual thoughts are welcome, and no criticism or justification is allowed in order to encourage participation. Though one can brainstorm individually, the technique works better in a group, as ideas expressed by one participant trigger more ideas from others, often based on associations, and the participants can benefit from each other’s experience and knowledge. Brainstorming using a software tool has a lot of advantages over the traditional way of capturing ideas like flip-charts or white-boards. The latter have physical size limitations, which constrain the process as the number of ideas grows. Ideas become scattered around the room, making it is easy to overlook important ideas. Further grouping and prioritizing of ideas is inconvenient and requires a lot of effort. ConceptDraw MINDMAP helps to avoid these problems. Read here how to run a Brainstorming session with ConceptDraw MINDMAP

Brainstorming Software

Brainstorming is an effective and widely used tool for generating large quantity of ideas by group of people in a short time. ConceptDraw MINDMAP is a powerful brainstorming software! ConceptDraw MINDMAP lets you easy and effectively generate and organize ideas and data, and also create the illustrative mind maps.

Product Overview

The role of ConceptDraw MINDMAP is to organize and plan idea development and communicate between process participants. Mind maps are convenient to prepare presentations for team and management and send task lists and related information.

ConceptDraw MINDMAP : Brainstorming, Mind Mapping for macOS and Windows

ConceptDraw MINDMAP is a powerful business and personal productivity software application that provides visual organization and access to information for individuals and organizations.

New Software Product

The launching of a new product on the market and its promotion are important tasks in the development and maintenance of the company's success. The process of launching a new product on the market allows the firm to establish itself in a particular segment, to remain competitive and to expand the sales volumes. To achieve the tangible success, the product must to be not just new, but with a certain set of unique qualities and characteristics, the relevance of which is determined at the initial stage of product development. The main objective of the review for a new product is to tell in details the consumers about the advantages of a given product, to offer the information about its unique and original qualities, the distinctive characteristics and competitive advantages, and about the nuances of used technologies, etc. The presented Mind Map created using the powerful drawing tools of ConceptDraw MINDMAP and ConceptDraw Solution Park visually illustrates an overview of a Twitter campaign for new software product.

Mind Map Making Software

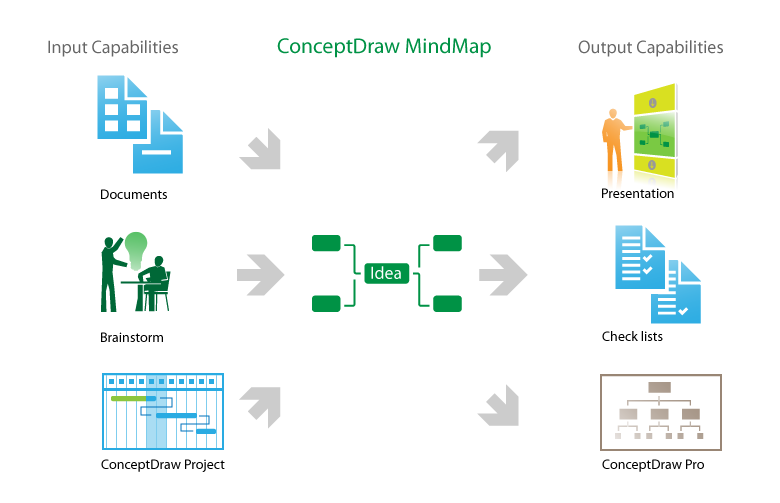
ConceptDraw MINDMAP is a powerful Mind Map making software, effective business and personal productivity application, which provides professional tools for thinking, brainstorming, generating and organizing ideas and data, for project planning, problem solving and many other tasks. ConceptDraw MINDMAP possess power, economy, and versatility, which help to raise personnel and team productivity. ConceptDraw MINDMAP allows you effectively generate, change, and update the Mind Maps. It provides variety of input and output solutions that allow create, change and share the Mind Maps quickly, simply and effectively. The use of desired Input template lets you create your own Mind Map in one moment. Discover today wide output and input capabilities of ConceptDraw MINDMAP. It lets to input the data from MS PowerPoint, MS Word, MS Project, XMind, MindManager, OPML and Text Outline sources, and also output your Mind Maps to MS PowerPoint, MS Word, MS Project, save as PDF, Web-page, Text Outline, RTF, OPML, or image.

Use a Fishbone Diagram to Attack Complex Problems

Any project is a complex system which rarely goes without some problems, even the most minor. But the success of the project mostly depends from the ability effectively solve appearing problems. There are many methods for problem solving, one of the most effective is the use a Fishbone diagram to attack complex problems. Use ConceptDraw DIAGRAM diagramming software with Fishbone Diagrams Solution to attack any complex problems with fishbone diagrams graphic method. Construct Fishbone diagram to help users brainstorm and break down a complex problem.

Tweet, twitter, mindmap, mind map, mindmapping tools, sending of Tweets, Effective Message with Twitter, solution park MindTweet

Tweet, twitter, mindmap, mind map, mindmapping tools, sending of Tweets, Effective Message with Twitter, solution park
This solution extends ConceptDraw MINDMAP software with the ability to brainstorm, review and organize the sending of Tweets.

Cause and Effect Diagram Software

The Cause and Effect diagram introduced by Kaoru Ishikawa in 1968 is a method for analyzing process dispersion. It can help you to dive into a problem and find an effective solution, identify and represent the possible causes for an effect, analyze the complex business problems and successfully solve them. You can design your Cause and Effect diagram on a paper, but more effective way is to use specific software - ConceptDraw DIAGRAM is a powerful Cause and Effect Diagram Software. It helps you create Cause and Effect diagram known also as Fishbone diagram or Ishikawa diagram from templates and examples.

6 sigma

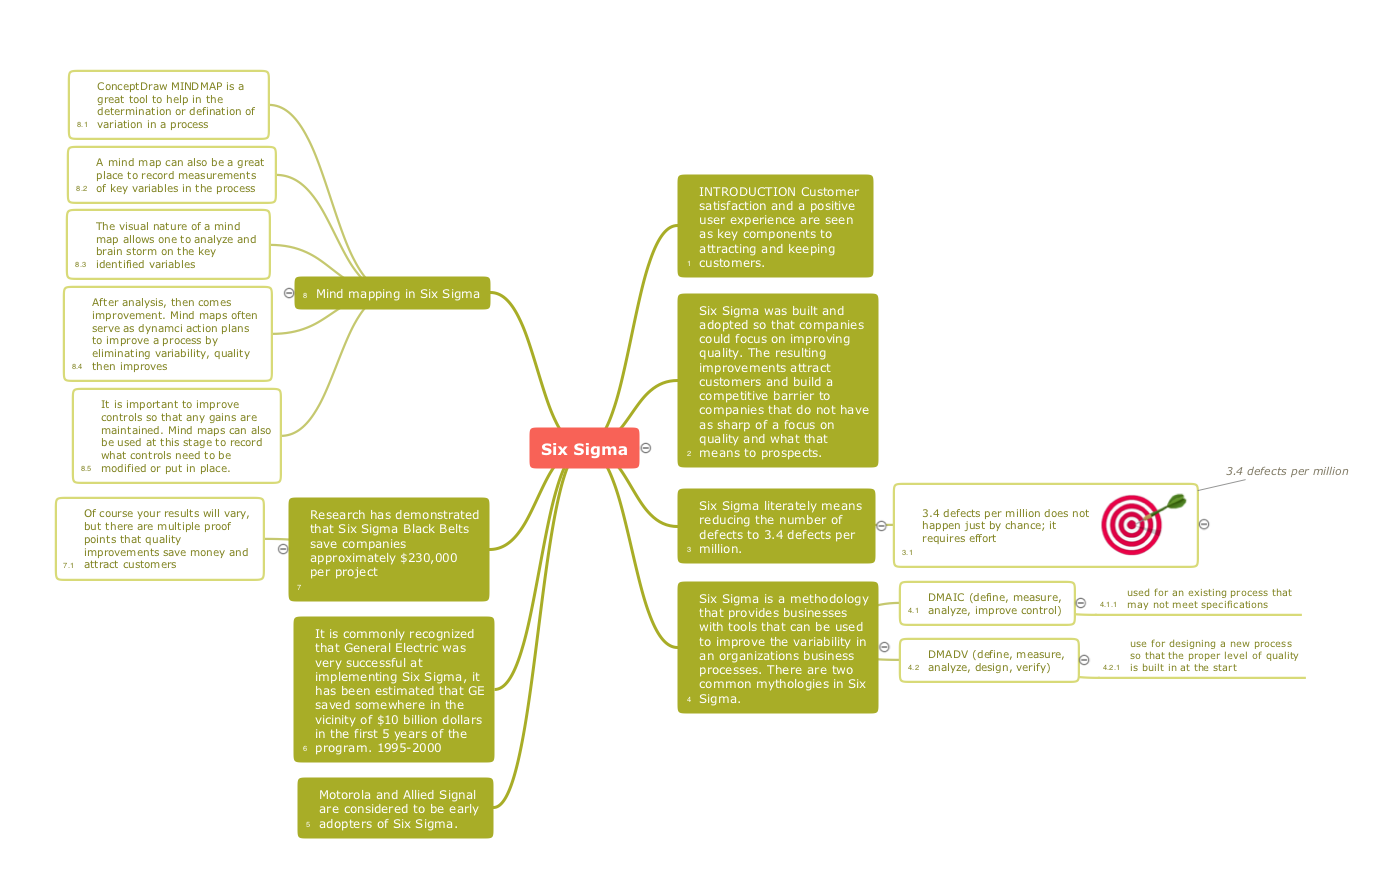
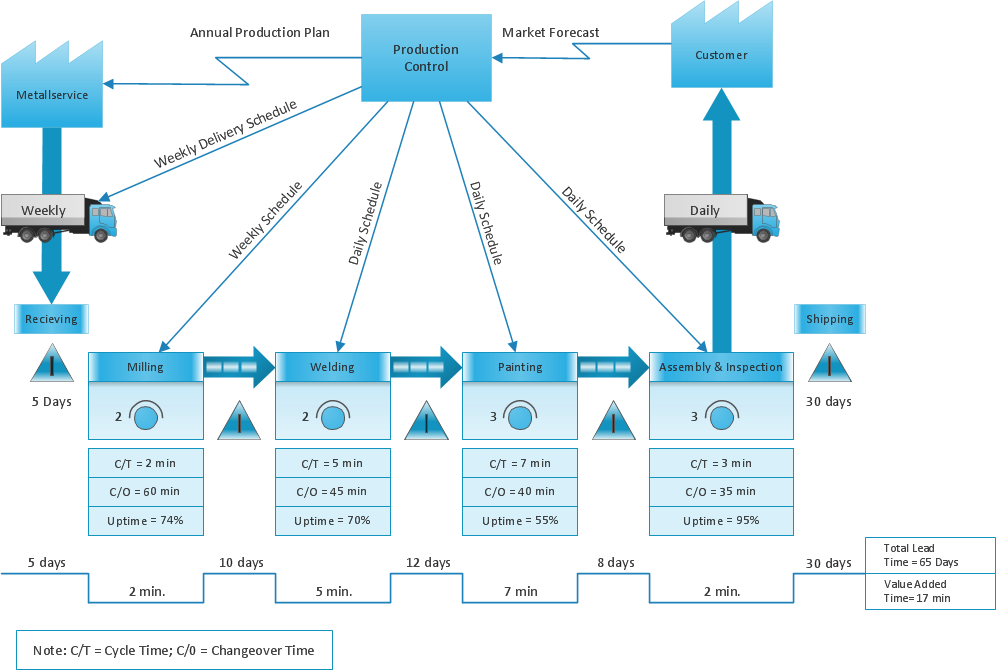
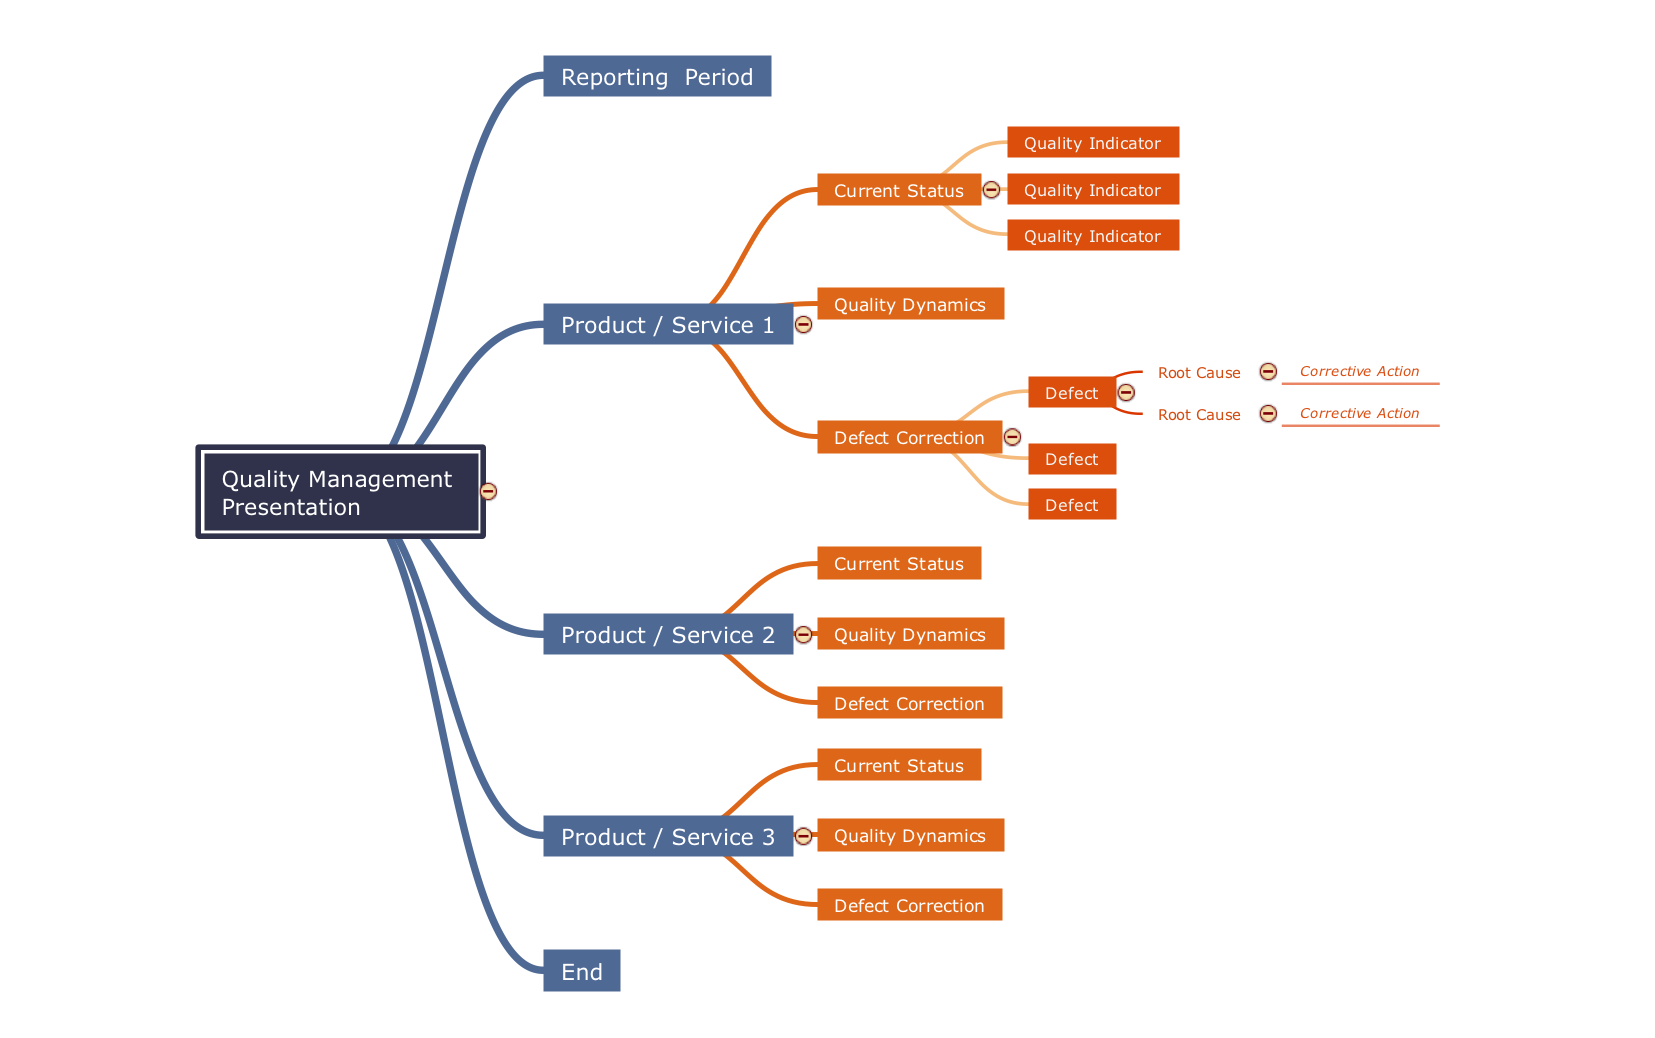
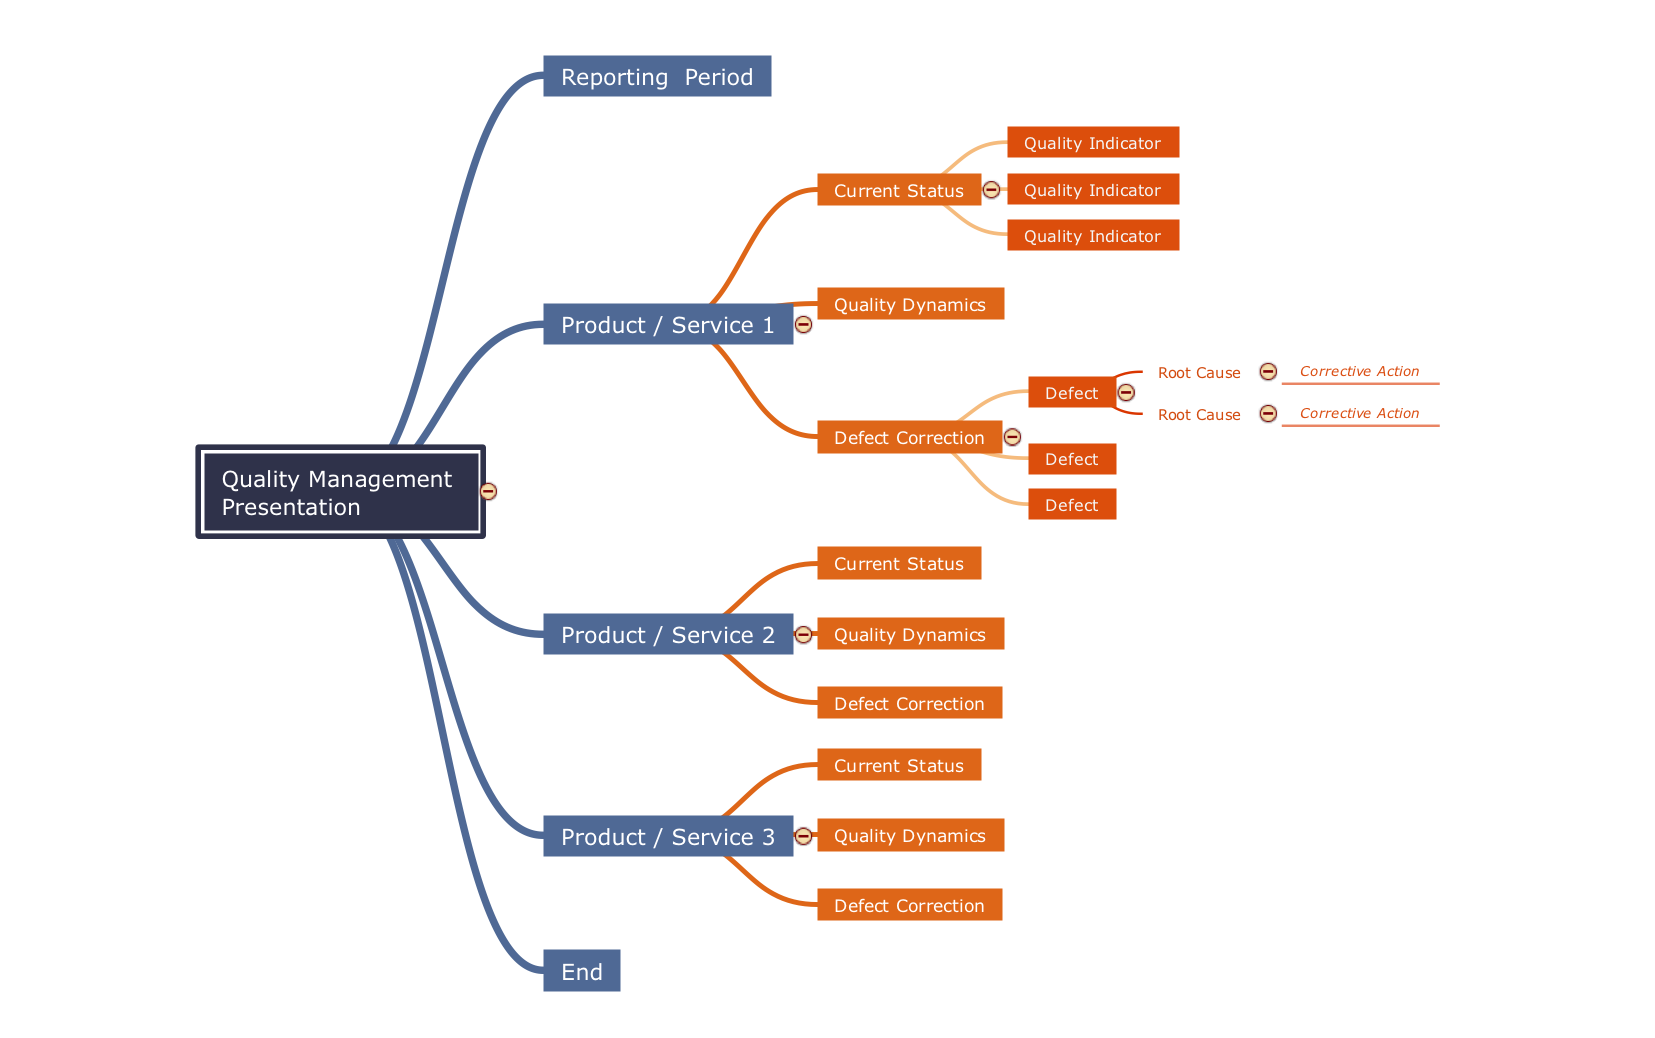
6 Sigma is a popular management concept aimed at improving the quality of work of an organization or individual units and at continuous perfection the processes. The improvement of organization's activities may be executed through the radical changes or in consequence to minor regular improvements. The main purposes of these improvements may be increasing of product safety, improvement quality, decreasing the quantity of defects, shorter the manufacturing cycle, improvement the workplaces, reducing costs, etc. Currently, Six Sigma is applied by organizations of various activity spheres, from the industrial enterprises to the banks. 6 Sigma uses a set of different tools of quality for realizing the improvements and control the processes. Each organization applies its own set of tools, such as Pareto chart, Ishikawa diagram, Tree diagram, etc. Solutions from the Quality area of ConceptDraw Solution Park support quality and manufacturing managers with powerful visualization tools for production quality control and improvement, and supply the ConceptDraw MINDMAP software with Quality Management Mind Maps. This map illustrates how the Six Sigma methodology can be represented as a Mind Map.

Business Productivity - Marketing

Mind Map is effective tool for depiction the main idea and related concepts, and representation a thought process. Mind Maps have essential value in marketing field, advertising and sales. They help successfully accomplish marketing goals and easy get marketing answers, to achieve a sustainable competitive advantages and increasing sales. Mind Maps help in new product development, they allow to generate and structure ideas about its properties and features, to define the target customers, brainstorm the key words and phrases for advertising and sales materials. ConceptDraw MINDMAP is a perfect marketing diagramming and marketing strategy tool that help accomplish marketing goals, represent marketing information and easy design Marketing Mind Maps and Marketing Diagrams (Marketing Step Chart, Marketing Mix Diagram, Market Environment Analysis Charts, Sales Pyramids, Target and Marketing Scope Diagrams, Feature Comparison Chart, Product Position Map, Products Comparison Chart, Timeline, SWOT, Boston Growth Matrix, Ansoff Product-Market Growth Matrix) for further using in visual documents and presentations.

Affinity Diagram

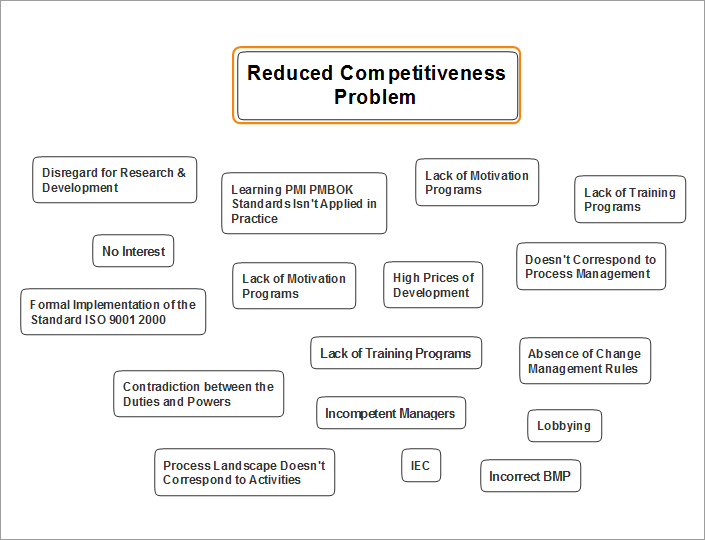
The Affinity Diagram, also known as a KJ diagram, is a business tool invented for organization the large quantity of ideas and data. It is a part of Seven Management and Planning Tools, it is usually used right after brainstorming to sort large numbers of ideas into the corresponding groups. The Affinity Diagram helps to represent in a better way the structure of large and complex factors which influence on a problem, divides these factors into the smaller and simpler structures, and helps team members to see the patterns and identify possible solutions to problems they have. The diagrams of this type don't show the causal relationships between the factors, but they are designed to prepare the data for holding further analysis of the cause-effect relationships. Another area of Affinity Diagram usage is contextual inquiry as a way to sort observations and notes from field interviews, support call logs, open-ended survey responses organizing, etc. ConceptDraw MINDMAP software offers you the tools for easy holding brainstorming, generation ideas and creation MINDMAP Affinity Diagram.

Steel Presentation

The presentation clearly shows the attractiveness of the project, product or service, its strengths, the irrefutable advantages and compelling arguments. The success of presentation depends on the competent combination of text with high-quality visual design. It is recommended to represent a moderate amount of text and supplement it by attractive and stylish images, photos, graphs and diagrams. However, they do not necessarily have to be bright, in some cases vice versa is appropriate to withstand a discreet, strict and business steel style, especially when you need that design of presentation did not distract from the main content of the project. The background should have the soothing color shade, which will not prevent to perception of information, and the font should to be large and clear, without unnecessary fanciful elements. ConceptDraw MINDMAP software lets create attractive Mind Maps and ConcepDraw DIAGRAM software helps design professional-looking diagrams, infographics and illustrations, that you can then output in one click to MS Power Point presentation. Create quickly and easily the most informative and memorable presentations with ConceptDraw Office applications.

Idea Outline

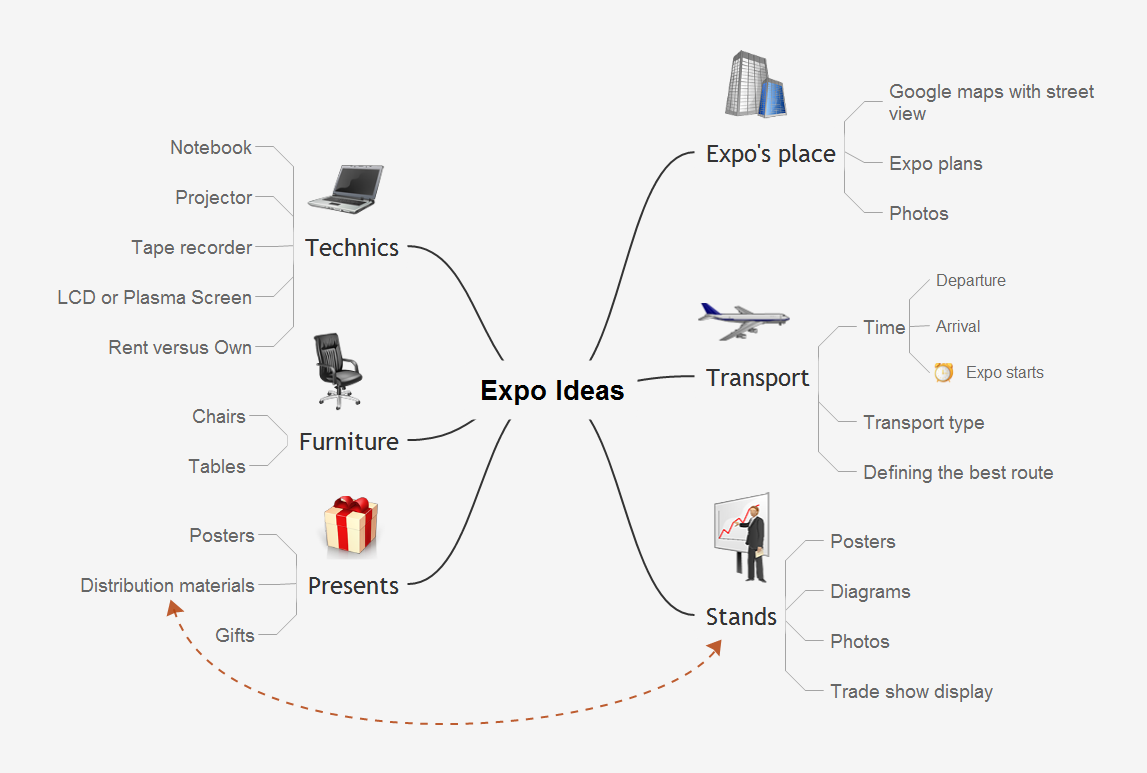
ConceptDraw MINDMAP is a powerful brainstorming software, the best application for ideas communication, for outlining ideas and data, for organizing arguments and other information. ConceptDraw MINDMAP software and solutions offered by ConceptDraw Solution Park help to hold the brainstorming session, to brainstorm a lot of new ideas, to outline your ideas, to make the Mind Map from the new ideas and concepts, to show new ideas at the presentation, efffectively communicate them and report at the meetings and conferences. The good ideas outline saves your time and helps visually explain your ideas for other people. Outline effectively your ideas using varied tools offered by ConceptDraw MINDMAP and make sure that it is very easy. The wide export capabilities of ConceptDraw MINDMAP are also helpful for ideas communication and collaboration with colleagues which don't have installed ConceptDraw Office applications. You can create automatically the MS PowerPoint presentation or MS Word document from the content of the active page of your map with a simple click.

Relations Diagram

The Relations Diagram is used to identify how the factors influence each other, to determine what factors are causes and what are effects. The factors mostly influencing are called “drivers”, the primarily affected factors are “indicators”. The problem solving is focused on the change of "drivers" factors by applying the corrective actions. The "indicators" factors help establish the Key Performance Indicators (KPIs) to monitor the changes and also define the effectiveness of the corrective actions in resolving a problem. ConceptDraw MINDMAP software ideally suits for designing Relations Diagrams. The easiest way to create the MINDMAP Relations Diagram, is to use the included Relations Diagram input template. Open it in ConceptDraw MINDMAP application from the Input tab and hold a new brainstorming session, identify the central issue and the contributing factors to this issue. Click the Finish Brainstorm button to generate a Mind Map and begin the further work with it, or select Relations Diagram item from the Output tab to automatically draw it in ConceptDraw DIAGRAM application.

Mind Mapping Software

ConceptDraw MINDMAP is effective Mind Mapping Software with rich clipart galleries, extensive drawing capabilities, a large quantity of examples of professionally designed mind maps on the different themes and powerful import and export capabilities.