 Dashboards Area
Solutions from the area Dashboards of ConceptDraw Solution Park collects templates, samples and vector stencils libraries with of data driven charts and indicators for drawing the basic types of Visual Dashboards.
Data Visualization Software Solutions
To see how your business can improve you can try data visualization software solutions that allows you visualize all your sales KPI in one sales dashboard allows you monitor and analyse sales activities.Best Tool for Infographic Construction
ConceptDraw is a best data visualization tool that will allow everyone to create rich infographics and visualizations quickly and easily.
 ConceptDraw Solution Park
ConceptDraw Solution Park collects graphic extensions, examples and learning materials
Business Graphics Software
ConceptDraw DIAGRAM is a business graphics software that allows you improve your business using Sales Performance Dashboard helps you analyze your data more efficiently.HelpDesk
How to Create a Time Series Dashboard
Time Series Dashboard means integration of some type of diagrams: Line Charts, Bar Charts, Column Charts, and Dot Plots on a single space. The ConceptDraw Time Series Dashboard solution can be used to create the interactive Time Series dashboard. The libraries of Time Series Charts solution contain the Live Objects, that can change their appearance depending on the external data. Each chart from the Time Series dashboard displays particular source data. You can include Time Series Charts in your business or technical dashboards to show and compare the items changing over time.Comparing ConceptDraw DIAGRAM to Omnigraffle
Comparing ConceptDraw DIAGRAM to Omnigraffle you can see a lot of benefits of ConceptDraw products. First, the main, ConceptDraw applications are cross-platform and available in two independent and concurrent versions for Macintosh (macOS) and PC (Windows). ConceptDraw gives you the per named license, that you can use simultaneously for your both Macintosh and PC, at work and at home. Free access to the ConceptDraw Solution Park offers you the great number of solutions with hundreds of templates and samples, and thousands of ready-to-use vector objects for quick and easy creation diagrams, drawings, illustrations and Mind Maps. Besides, thanks to Ingyre Technology is provided the integration with Microsoft Office applications and capabilities of limitless exchange the information. The ConceptDraw Live Objects technology lets you design the visual dynamically-updated dashboards, the Rapid Draw technology allows creating the diagrams in minutes. The extensive presentation capabilities help you create lush and beautiful presentation slideshows from your ConceptDraw documents.HelpDesk
How to Create a Sales Dashboard
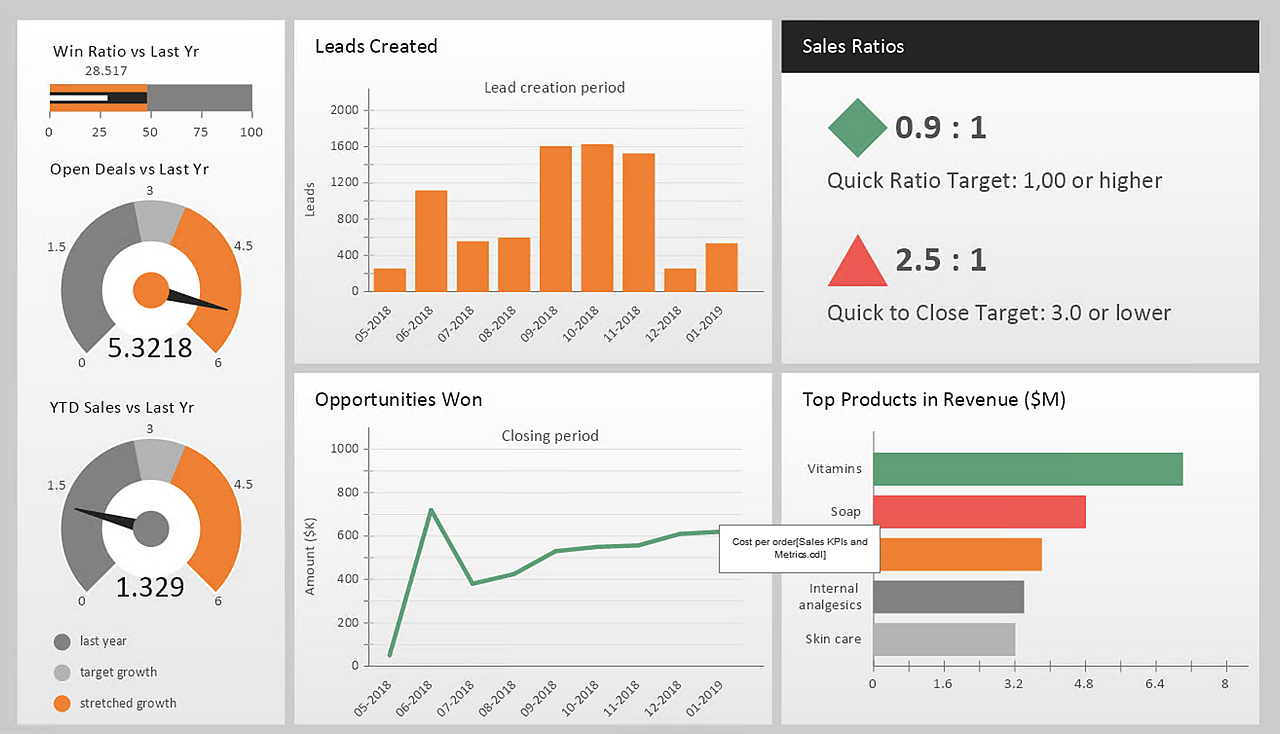
A visual dashboard is a valuable tool for any sales team. Sales dashboard allows you to view and monitor sales indicators that are important for manager and sales staff. It helps to use timely and reliable information to improve the quality of sales performance and increase sales revenues. ConceptDraw Sales Dashboard solution is a tool for both: sales manager and sales team. It provides the visualization of key performance indicators that are critical to the entire sales organization. The custom sales dashboard displays real-time information on sales performance KPIs with the help of intuitive and easy-to-understand diagrams and charts.
 Composition Dashboard
Composition dashboard solution extends ConceptDraw DIAGRAM software with templates, samples and vector stencils library with charts and indicators for drawing visual dashboards showing data composition.
 ConceptDraw Dashboard for Facebook
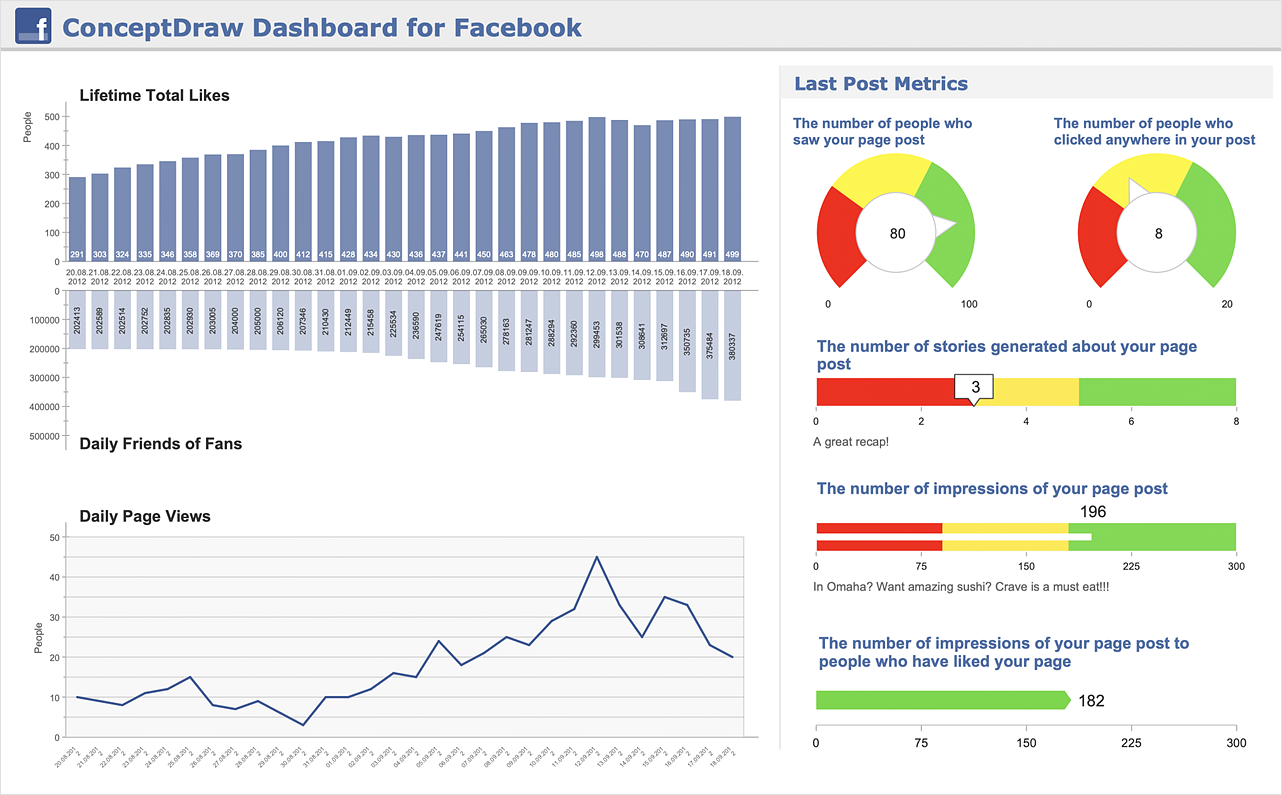
ConceptDraw Dashboard for Facebook solution extends ConceptDraw DIAGRAM software with a dynamically updated visual dashboard, which shows lifetime total likes, daily friends of fans, and daily page views, information you can receive from Facebook Insights.
Business Diagram Software
When managing the projects, people, or networks, there are daily designed and used different types of Business diagrams, so the powerful drawing software will be very useful for this. ConceptDraw DIAGRAM with large quantity of business solutions will meet your needs and will help you convey your ideas successful and rapidly, no matter are you professional or beginner. It is the best choice for business specialists and technical professionals who need quickly and easily explore, visualize, and communicate information. ConceptDraw DIAGRAM business diagram software is the most powerful business software and relational charting software. Create advanced, completely customizable Business Process Diagrams, Business Flow Charts, Work Flow Diagrams, Organizational Charts, Audit diagrams, Marketing diagrams, Value Stream Maps, TQM diagrams, ERD diagrams, EPC diagrams, Cause and Effect diagrams, Infographics, Dashboards, and other Relational business diagrams from your data using the powerful drawing tools of ConceptDraw Solution Park.
HelpDesk
How to Use ConceptDraw Dashboard for Facebook on Mac
The ConceptDraw Dashboard for Facebook Solution is a visual dashboard that visualizes lifetime total Likes, daily Friends of Fans, and daily Page views based on the information exported from your Facebook Page.
 Status Dashboard
Status dashboard solution extends ConceptDraw DIAGRAM software with templates, samples and vector stencils libraries with graphic indicators for drawing the visual dashboards showing status data.
- Spatial Infographics | Tools to Create Your Own Infographics ...
- Business Intelligence Dashboard Software | Design elements ...
- Flowchart Software | Sales Dashboard | Spatial Infographics | Any ...
- Spatial Dashboard | Europe spatial dashboard - Template | Spatial ...
- Composition Dashboard | What are Infographic Area | How To ...
- Construction Project Chart Examples | PM Dashboards | Best Tool ...
- Spatial Dashboard | Spatial Infographics | Design elements ...
- Design elements - Thematic maps | Spatial Dashboard | Spatial ...
- Basic Flowchart Symbols and Meaning | Marketing Plan Infographic ...
- Reporting & Data Visualization | Data Visualization Software ...
- Note Exchange | Time Series Dashboard | Spatial Infographics ...
- Data Visualization Software Solutions | Data Visualization Solutions ...
- Flowcharts | Electric and Telecom Plans | What are Infographic Area ...
- Spatial infographics Design Elements: Transport Map | Spatial ...
- Data Visualization Software Solutions | Visualization Spatial Data ...
- Daily Infographic | Infographic Examples | Management Tools | Daily ...
- What are Infographic Area | Sales Dashboard | Business Processes ...
- Spatial Data Analysis | Informative and Well-Designed Infographics ...
- Construction Dashboard Templates
- What are Infographic Area | Sales Dashboard | Sales Dashboard ...


