HelpDesk
How to Use Mind Map Exchange Solution
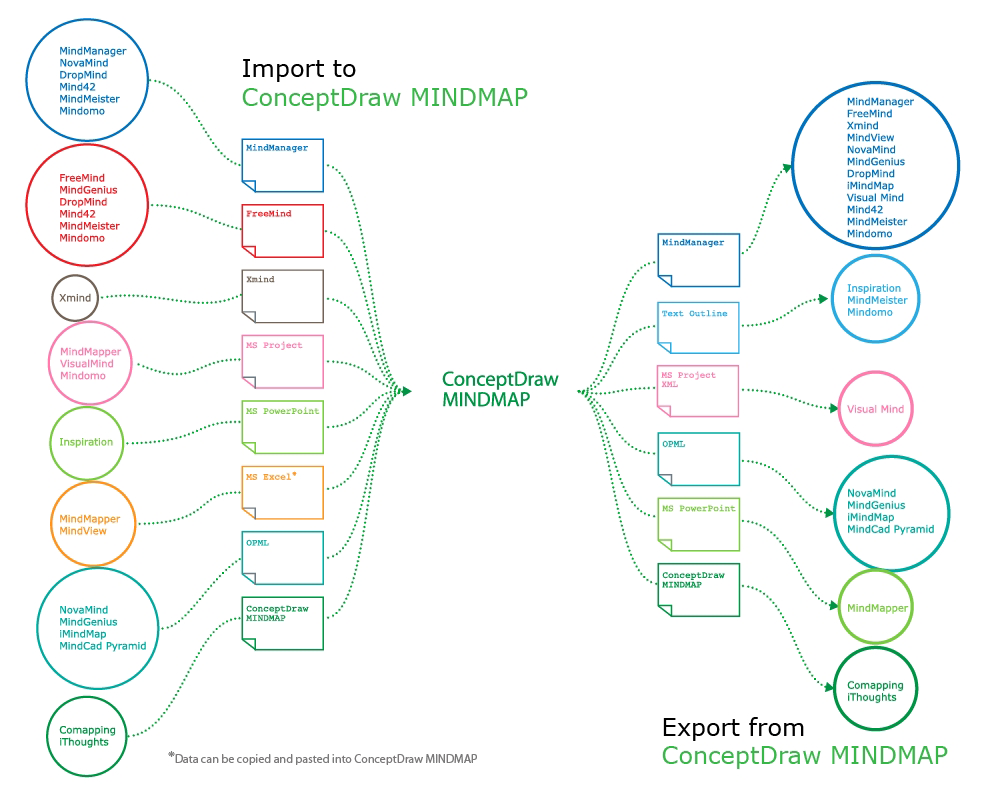
Using ConceptDraw MINDMAP you can import and export files of Microsoft Project, MindManager, XMind, FreeMind, Microsoft Office, and many other project management and mind mapping applications. You can create your own mind map based on the incoming files of different mind mapping software, and then export the final mind map to any desired format from the list of supported ones.Geo Mapping Software Examples - World Map Outline
An Example world map, showing a simple outline of world map. The world map is vector and can be edited or export to svg format.Geo Map Software
Geo Map Software - Full Geographic Reach of Your Business with Geo Map Shapes.Subway infographic design elements - software tools
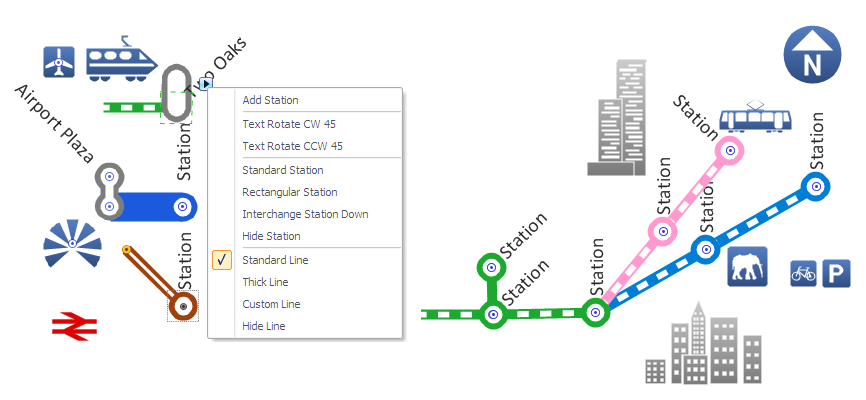
Subway infographic design elements of MetroMap and ConceptDraw software tools.Mind Map Making Software
ConceptDraw MINDMAP is a powerful Mind Map making software, effective business and personal productivity application, which provides professional tools for thinking, brainstorming, generating and organizing ideas and data, for project planning, problem solving and many other tasks. ConceptDraw MINDMAP possess power, economy, and versatility, which help to raise personnel and team productivity. ConceptDraw MINDMAP allows you effectively generate, change, and update the Mind Maps. It provides variety of input and output solutions that allow create, change and share the Mind Maps quickly, simply and effectively. The use of desired Input template lets you create your own Mind Map in one moment. Discover today wide output and input capabilities of ConceptDraw MINDMAP. It lets to input the data from MS PowerPoint, MS Word, MS Project, XMind, MindManager, OPML and Text Outline sources, and also output your Mind Maps to MS PowerPoint, MS Word, MS Project, save as PDF, Web-page, Text Outline, RTF, OPML, or image.Value Stream Mapping Software
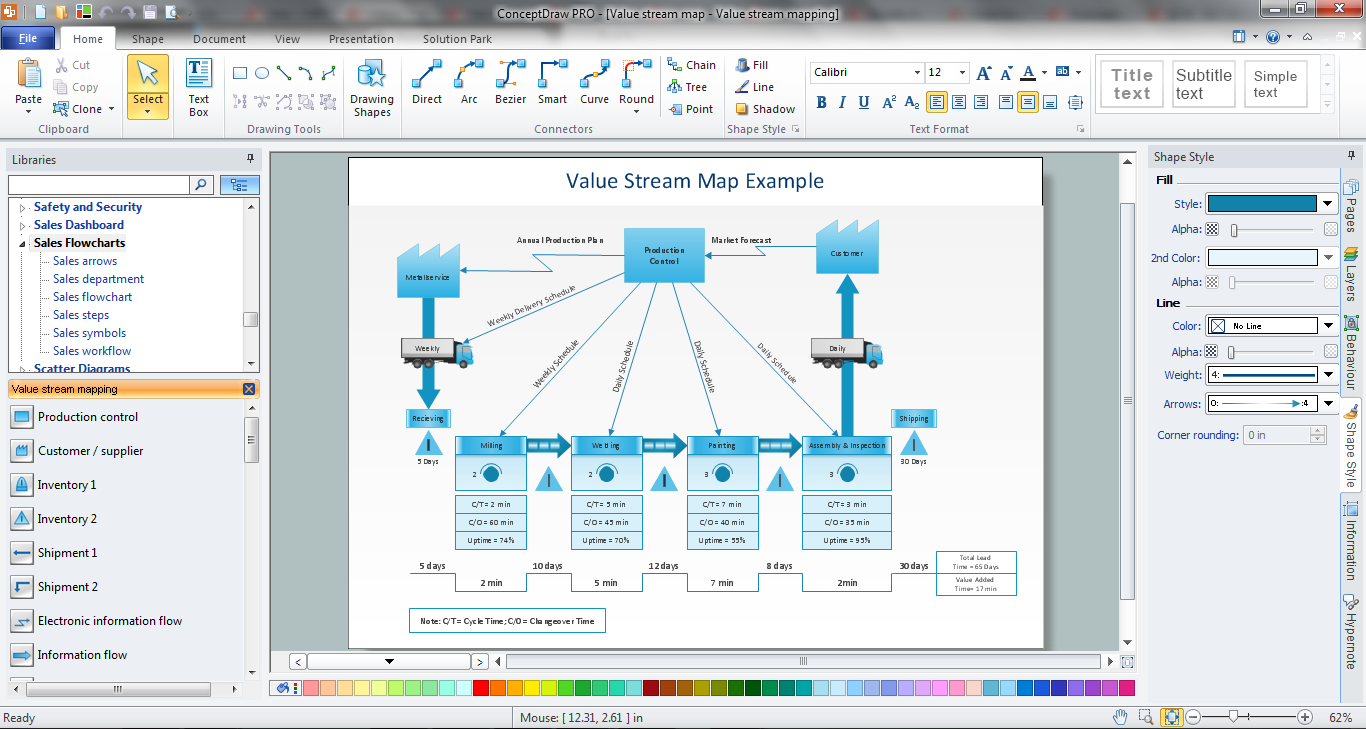
ConceptDraw DIAGRAM is the best Value Stream Mapping software. The graphical representation of a process is a powerful tool. It helps in the diagnosis of process efficiency and allows companies to develop improved processes. The new Value Stream Mapping solution found in the ConceptDraw Solution Park continues to extend the range of ConceptDraw DIAGRAM into a business graphics tool used to document processes in any organization.Quality Management Teams
ConceptDraw MINDMAP with Quality mindmaps solution as a demonstration of the creative approach to quality management in daily work of quality management team.How to exchange data files of major mind mapping software?
ConceptDraw MINDMAP software included to powerful ConceptDraw Office suite is applied for professional creation the Mind Maps, for effective managing the communications within the work group or team, for holding brainstorming sessions. The ability of exchanging the documents and files of different types, including Mind Maps is very useful for users that need to collaborate, but apply varied applications in their work. ConceptDraw MINDMAP supports the export to many Microsoft Office products, such as MS Word, MS PowerPoint, MS Project, as well as export to PDF, HTML, Evernote, Apple iCal, and different graphic format files. The Mind Map Exchange solution from the Collaboration area of ConceptDraw Solution Park makes the ConceptDraw MINDMAP software powerful in questions of exchanging the Mind Maps with large variety of major mind mapping applications, including Mindjet MindManager, FreeMind, XMind. If you can't to find some file format you need at the import / export list, you can refer to the third party applications to import or export the files through them.Best Value Stream Mapping mac Software
Create value stream maps - for value stream analysis and value stream management, material and information flow mapping, using our quick start templates included with ConceptDraw.Maps and Directions
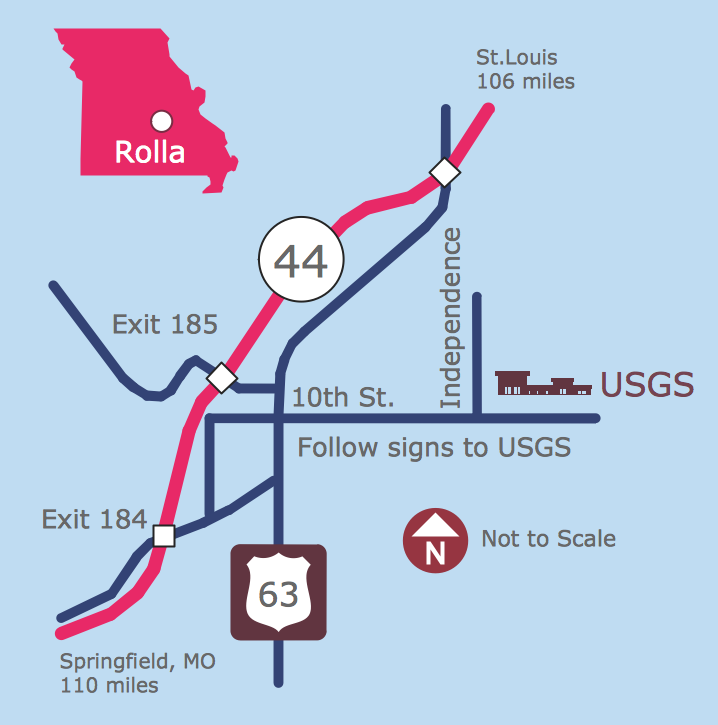
ConceptDraw DIAGRAM diagramming and vector drawing software extended with Directional Maps Solution from the Maps Area of ConceptDraw Solution Park is a powerful maps and directions design software. Let's review the tools of this solution.Mind Map - Quality Structure
ConceptDraw MINDMAP is a good way to describe visual instructions on any quality process.The best Quality Mind Maps software
ConceptDraw MindMap is the best Quality mind mapping software. It lets you easily identify the critical points during a conference call.One formula of professional mind mapping : input data + output data + make great presentation
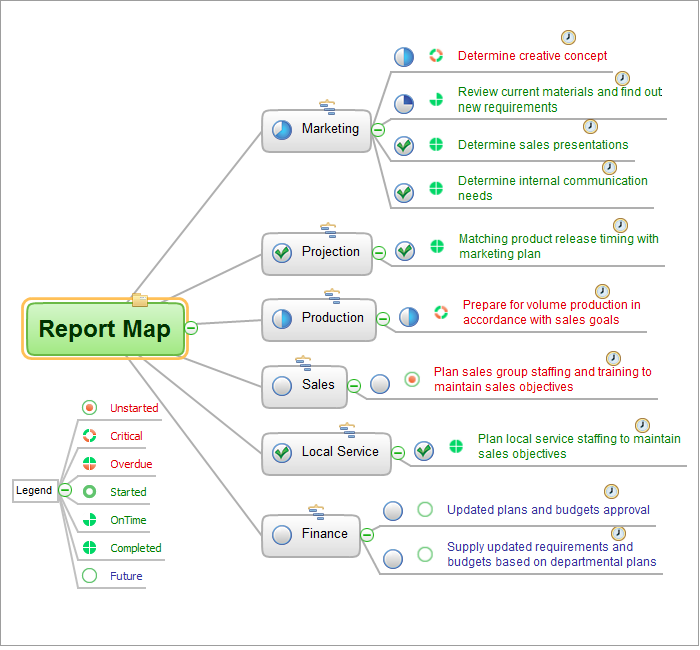
ConceptDraw MINDMAP is a powerful software from ConceptDraw Office suite, which provides a lot of tools and components for professional Mind Mapping. Besides the extensive tools for creation attractive and great-looking Mind Maps, it offers also wide import capabilities from MS Office files and mind mapping files MindJet MindManager, XMind and FreeMind, extensive export capabilities to common formats, such as PDF, HTML, different graphic formats, the possibility to generate MS Office documents, Project Management reports, PowerPoint presentations and demonstrate them via Skype conference call. Use of Skype conference call feature lets you to demonstrate the presentation's slide show and control it on computers of Skype call participants. This Report Mind Map example created in ConceptDraw MINDMAP software depicts the current project status and includes many pages and slides. This Project Status Report can be easy played as a slide show presentation on the large screen or to remote team using Skype conference call.Mind Mapping Software
ConceptDraw MINDMAP is effective Mind Mapping Software with rich clipart galleries, extensive drawing capabilities, a large quantity of examples of professionally designed mind maps on the different themes and powerful import and export capabilities.How To create Value Stream Map (VSM)
Value Stream Map template helps you to create VSM diagrams using ConceptDraw DIAGRAM software.Value-Stream Mapping for Manufacturing
Create value stream maps - for value stream analysis and value stream management, material and information flow mapping, using our quick start templates included with ConceptDraw.Lean Value Stream Map
Lean Manufacturing tool is a new Value Stream Mapping solution found in the ConceptDraw Solution Park.Value Stream Mapping - Design Elements
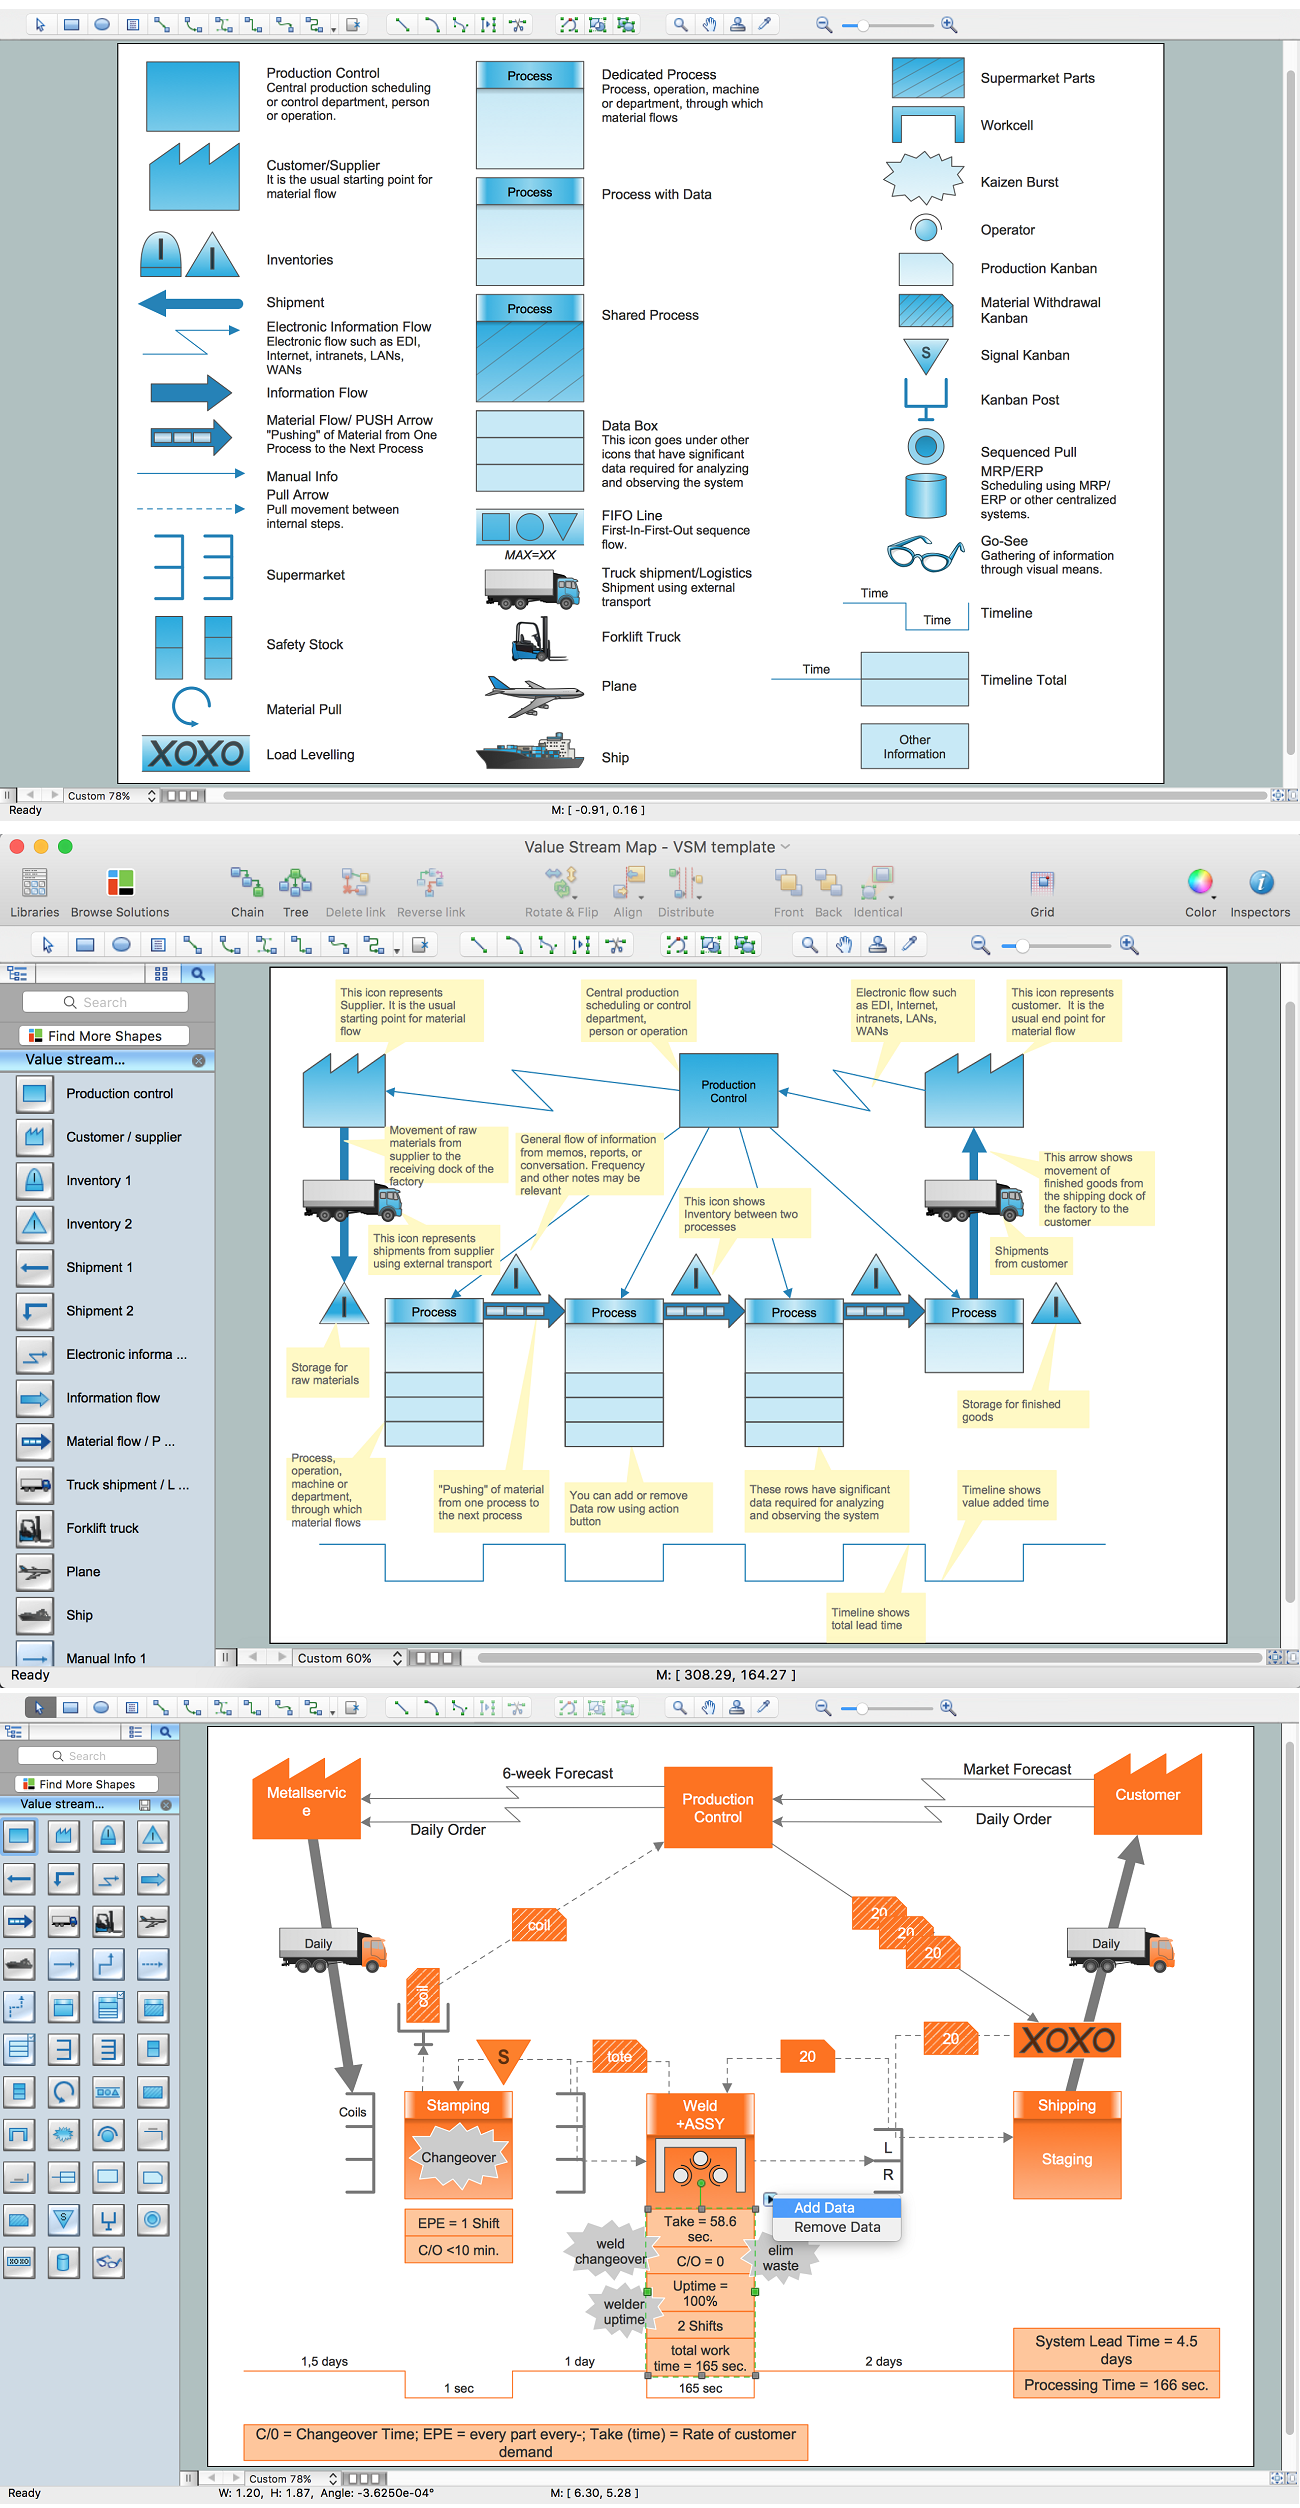
ConceptDraw DIAGRAM is a software for making Value Stream Mapping diagram with more than 10 library objects that are scalable vector images.
 Directional Maps
Directional Maps solution extends ConceptDraw DIAGRAM software with templates, samples and libraries of vector stencils for drawing the directional, location, site, transit, road and route maps, plans and schemes.
- Conceptdraw.com: Mind Map Software , Drawing Tools | Project ...
- Concept Maps | Process Flowchart | ConceptDraw Solution Park ...
- Quality Mind Maps | Hardware Software Mapping Deployment
- Best Value Stream Mapping mac Software
- Directional Map Software
- Metro Map | Value Stream Mapping Software | Solution Map Software
- Directions Map | Maps and Directions | Software To Draw Road Maps
- Geo Mapping Software Examples - World Map Outline | World ...
- Metro Map | Concept Mapping Software - Conceptdraw.com


