 EXPRESS-G data Modeling Diagram
EXPRESS-G data Modeling Diagram solution extends the ConceptDraw DIAGRAM software functionality with capabilities of EXPRESS data modeling language, includes powerful data modeling tools, Express-G diagram tool, database diagram tool, database design tool, wide variety of pre-made vector objects of EXPRESS-G notation and EXPRESS-G diagrams samples allowing software developers, software designers, software engineers and other stakeholders to make their data models for information systems, to develop the databases, to learn the principles of construction EXPRESS-G diagrams and helping to draw their own EXPRESS-G Data Modeling Diagrams, Express-G Diagrams or Database Model Diagram without any efforts.
Business Process Elements: Events


UML Composite Structure Diagram. Design Elements

Express-G Diagram

Data modeling with ConceptDraw DIAGRAM

 Computer and Networks Area
The solutions from Computer and Networks Area of ConceptDraw Solution Park collect samples, templates and vector stencils libraries for drawing computer and network diagrams, schemes and technical drawings.
 Entity-Relationship Diagram (ERD)
Entity-Relationship Diagram (ERD) solution extends ConceptDraw DIAGRAM charting and vector drawing software with the ability to describe a database using the Entity-Relationship model. This solution includes icons advocated by Chen’s and Crow’s Foot notation that can be used when describing a database. The vector graphic diagrams produced when using this solution can be employed in your white papers, presentations, data sheets, posters, or any technical material.
How To Create a Flow Chart in ConceptDraw

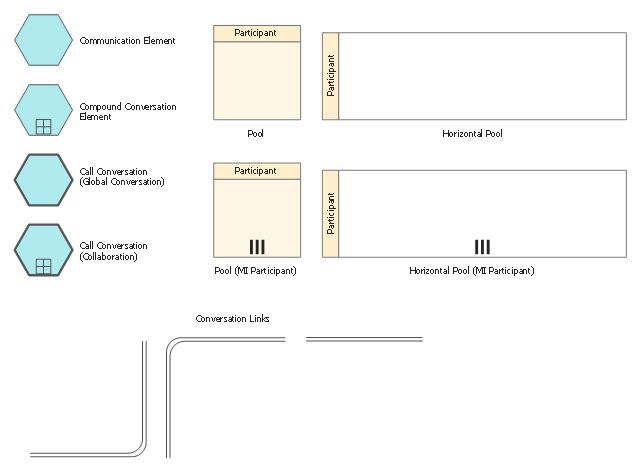
The vector stencils library "Conversations" contains 11 symbols: communication element, compound conversation element, call conversation (global and collaboration), conversation links, pools. Use these shapes for drawing BPMN 2.0 conversation diagrams using the ConceptDraw PRO diagramming and vector drawing software.
"Conversation-Model.
The new Conversation-Model is used to model a "who with whom and what"-view of processes. All process participants can be included in a compact form of modeling as long as denoting which communication is involved.
Process participants are represented as Pools (collapsed...) in Conversation-Models. The Communication-Shape defines a set of logically related message exchanges which are tied to Pools via Conversation-Links. If there is a multi-instanced Pool (also introduced with BPMN 2.0) involved, a Forked Conversation-Link is used for it.
Furthermore Sub-Conversations can be used to define abstractions." [en.bpmn-community.org/ tutorials/ 34/ ]
The example "Design elements - Conversations (BPMN 2.0)" is included in the Business Process Diagram solution from the Business Processes area of ConceptDraw Solution Park.
BPMN 2.0 conversation symbols
IDEF0 Visio

Diagramming Software for Design UML Activity Diagrams


Database Flowchart Symbols

Circular Diagram

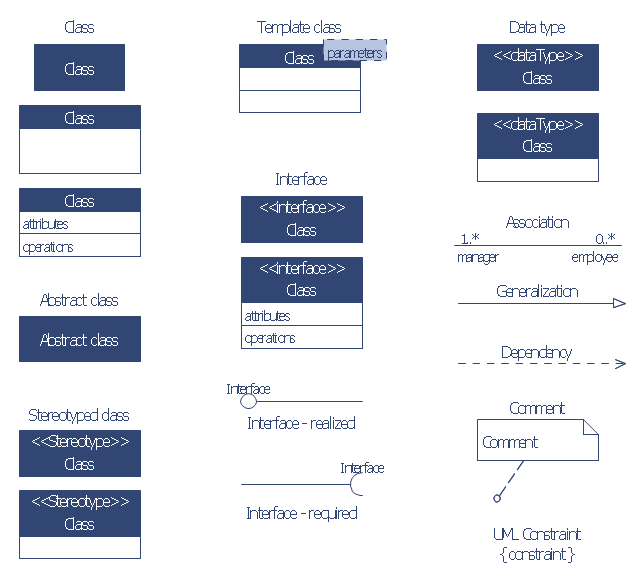
The vector stencils library "Bank UML class diagram" contains 19 shapes for drawing UML class diagrams.
Use it for object-oriented modeling of your bank information system.
"The class diagram is the main building block of object oriented modelling. It is used both for general conceptual modelling of the systematics of the application, and for detailed modelling translating the models into programming code. Class diagrams can also be used for data modeling. The classes in a class diagram represent both the main objects, interactions in the application and the classes to be programmed.
In the diagram, classes are represented with boxes which contain three parts:
* The top part contains the name of the class. It is printed in bold and centered, and the first letter is capitalized.
* The middle part contains the attributes of the class. They are left-aligned and the first letter is lowercase.
* The bottom part contains the methods the class can execute. They are also left-aligned and the first letter is lowercase.
In the design of a system, a number of classes are identified and grouped together in a class diagram which helps to determine the static relations between those objects. With detailed modelling, the classes of the conceptual design are often split into a number of subclasses." [Class diagram. Wikipedia]
This example of UML class diagram symbols for the ConceptDraw PRO diagramming and vector drawing software is included in the ATM UML Diagrams solution from the Software Development area of ConceptDraw Solution Park.
UML class diagram symbols
Modelling Complex Events with Event-Driven Process chain

Business Process Modeling Notation Template

How to Draw an Effective Flowchart

Examples of Flowcharts, Org Charts and More


How to Create a Process Flowchart

How to Use the ″Online Store PR Campaign″ Sample

- How to Create an IDEF0 Diagram for an Application Development ...
- UML Class Diagram Tutorial
- Introductory Guide to Rapid UML Solution | Uml Class Diagram ...
- UML Class Diagram Notation | Basics Of Uml Modeling
- Structured Systems Analysis and Design Method (SSADM) with ...
- UML Class Diagram Tutorial | Sample Project Flowchart. Flowchart ...
- Chen Notation | Design elements | Chen Notation Tutorial
- Data Flow Diagram (DFD) | UML Class Diagram Tutorial
- Design elements - ERD (crow's foot notation) | Er Modeling Tutorial
- Chen Notation | Design elements - ER diagram (Chen notation ...