How to Report Task's Execution with Gantt Chart
ConceptDraw PROJECT’s powerful reporting engine lets you generate a set of tabular reports with just one click, or visualize your project as Radial Tasks Structures, Work Breakdown Structures and Resource Calendars. It also provides you with dynamic Project Dashboards.How To Hold Project Collaboration via Skype
Project Management Trends. Status report presentation tool for remote teams, using Skype to collaborate on project objectives.
How To Create Project Report
ConceptDraw PROJECT contains an extensive tool set to help project managers. The rich data visualization capability that is provided by ConceptDraw products helps you create project dashboards, one-click reports, multi-project views, Gantt charts, and resource views. Let′s learn how to get maximum value using ConceptDraw PROJECT!One formula of professional mind mapping : input data + output data + make great presentation
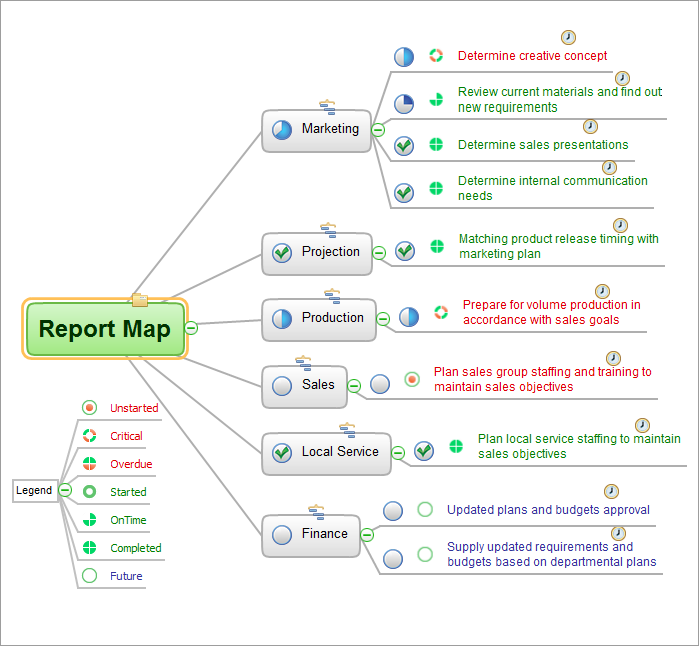
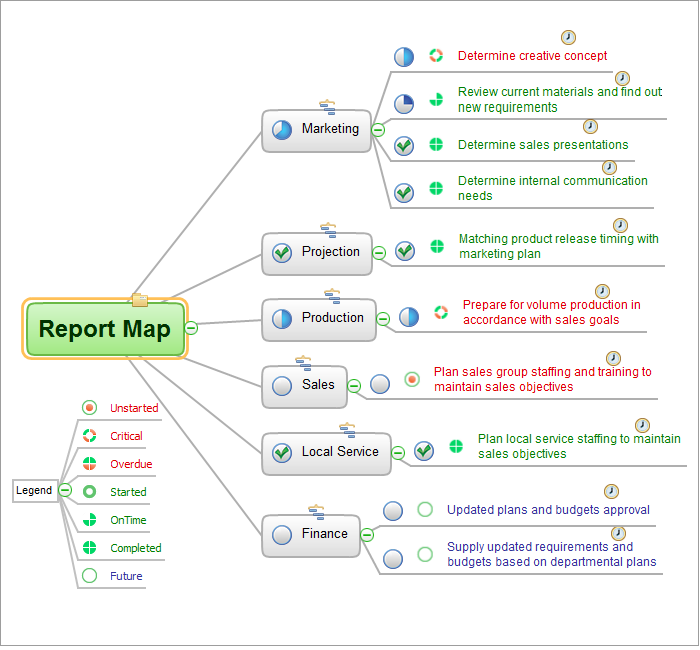
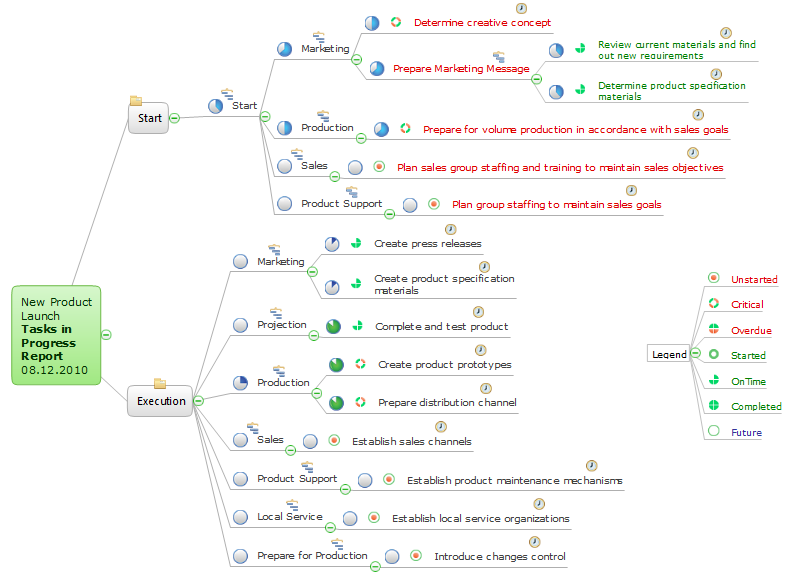
ConceptDraw MINDMAP is a powerful software from ConceptDraw Office suite, which provides a lot of tools and components for professional Mind Mapping. Besides the extensive tools for creation attractive and great-looking Mind Maps, it offers also wide import capabilities from MS Office files and mind mapping files MindJet MindManager, XMind and FreeMind, extensive export capabilities to common formats, such as PDF, HTML, different graphic formats, the possibility to generate MS Office documents, Project Management reports, PowerPoint presentations and demonstrate them via Skype conference call. Use of Skype conference call feature lets you to demonstrate the presentation's slide show and control it on computers of Skype call participants. This Report Mind Map example created in ConceptDraw MINDMAP software depicts the current project status and includes many pages and slides. This Project Status Report can be easy played as a slide show presentation on the large screen or to remote team using Skype conference call.Communication Tool for Remote Project Management
Communication is the main challenge and the key success factor for remote project management. Communicating visually via Skype you bring all team and customers onto the one page. Remote Presentation for Skype solution for ConceptDraw MINDMAP helps communicate with remote team and customers in visual manner on wide range of issues. Using this solution for regular status meetings allows you to push your team on tasks and keep task statuses up to date.Cross Functional Flowchart Examples
Take a look on an example of Cross-Functional-Flowchart, showing the software service cross-function process flowcharts among the different departments. It presents a simple flowchart among the customer, sales, technical support, tester and development. Try now Flowchart Software and Cross-Functional library with 2 libraries and 45 vector shapes of the Cross-Functional Flowcharts solution. Then you can use built-in templates to create and present your software service cross-function process flowcharts.Swot Analysis Examples
SWOT analysis is an advanced plan making methodology for detection the Strengths and Weaknesses, Opportunities and Threats, that are involved in a project. SWOT analysis possesses a wide variety of real and potential applications and is a key part of any business planning and analysis. SWOT analysis uses as a visual tool the SWOT diagrams and SWOT matrices. ConceptDraw DIAGRAM software with SWOT and TOWS Matrix Diagrams solution provides a lot of SWOT analysis examples and samples, and also numerous collection of built-in SWOT templates, which will be the good start in your self-depending drawing and the perfect source of inspiration. You can always start to design your SWOT diagrams from the blank sheet using the included predesigned vector objects, but in many cases to save the time and efforts for SWOT diagramming would be preferable to use the ready example the most appropriate to your needs. Customizing the proposed SWOT diagrams you will achieve a great success in drawing SWOT matrices of any style and complexity.UML Use Case Diagram Example. Social Networking Sites Project
UML Diagrams Social Networking Sites Project. This sample was created in ConceptDraw DIAGRAM diagramming and vector drawing software using the UML Use Case Diagram library of the Rapid UML Solution from the Software Development area of ConceptDraw Solution Park. This sample shows the Facebook Socio-health system and is used at the projection and creating of the social networking sites.Business Report Pie. Pie Chart Examples
This sample shows the Business Report Pie Chart. The Pie Chart visualizes the data as the proportional parts of a whole, illustrates the numerical proportion. Pie Charts are very useful in the business, statistics, analytics, mass media.How To Show Project Progress Peport on Web
Project progress on web: delivering project status to remote teams and stakeholders via Skype.
- ConceptDraw PRO DFD Software | Developing Website Full Project ...
- How To Create Project Report | Cross Functional Flowchart ...
- Software Project Dashboard Template
- How To Create Project Report | How to Generate ConceptDraw ...
- Entity-Relationship Diagram (ERD) | How To Create Project Report ...
- How To Create Project Report | Project management triangle ...
- Gantt charts for planning and scheduling projects | How To Create ...
- Example Of Flow Chart In Project Report
- Restaurant Project Report Sample


