Pyramid Diagram
The representation of data in a hierarchical or pyramid-like form is one of the most effective and illustrative ways of structuring the data, information, ideas in different fields, among them marketing, management, business, finances, sales, consulting, media, and some others. Pyramid Diagram perfectly suits for this goal, especially if we talk about the representing some marketing strategies, information systems, social strategies. Pyramid Diagram looks like a triangle or reversed triangle that is divided visually on several layers. Each layer can be colored with its own color, this lets visually highlight important moments. ConceptDraw DIAGRAM diagramming and vector graphics software extended with Pyramid Diagrams solution from the Marketing area provides powerful drawing tools, templates, samples, and built-in vector pyramid objects, thus all required tools for equally easy drawing Three level pyramid diagram, Four level pyramid model, Five level pyramid, etc., at this your Pyramid diagrams can have 2D or 3D view as you like.A four level pyramid model of different types of Information Systems based on the different levels of hierarchy in an organization. The first level represents transaction processing systems for workers. The second level represents management information systems for middle managers. The third level represents decision support systems for senior menegers. The fourth level represents executive information systems for executives.
"The "classic" view of Information systems found in the textbooks in the 1980s was of a pyramid of systems that reflected the hierarchy of the organization, usually transaction processing systems at the bottom of the pyramid, followed by management information systems, decision support systems, and ending with executive information systems at the top. Although the pyramid model remains useful, since it was first formulated a number of new technologies have been developed and new categories of information systems have emerged, some of which no longer fit easily into the original pyramid model.
Some examples of such systems are:
data warehouses,
enterprise resource planning,
enterprise systems,
expert systems,
search engines,
geographic information system,
global information system,
office automation." [Information systems. Wikipedia]
This diagram was redesigned using the ConceptDraw PRO diagramming and vector drawing software from Wikimedia Commons file Four-Level-Pyramid-model.png. [commons.wikimedia.org/ wiki/ File:Four-Level-Pyramid-model.png]
This file is licensed under the Creative Commons Attribution-Share Alike 3.0 Unported license. [creativecommons.org/ licenses/ by-sa/ 3.0/ deed.en]
The triangle chart example "Information systems types" is included in the Pyramid Diagrams solution from the Marketing area of ConceptDraw Solution Park.
Create Organizational Chart
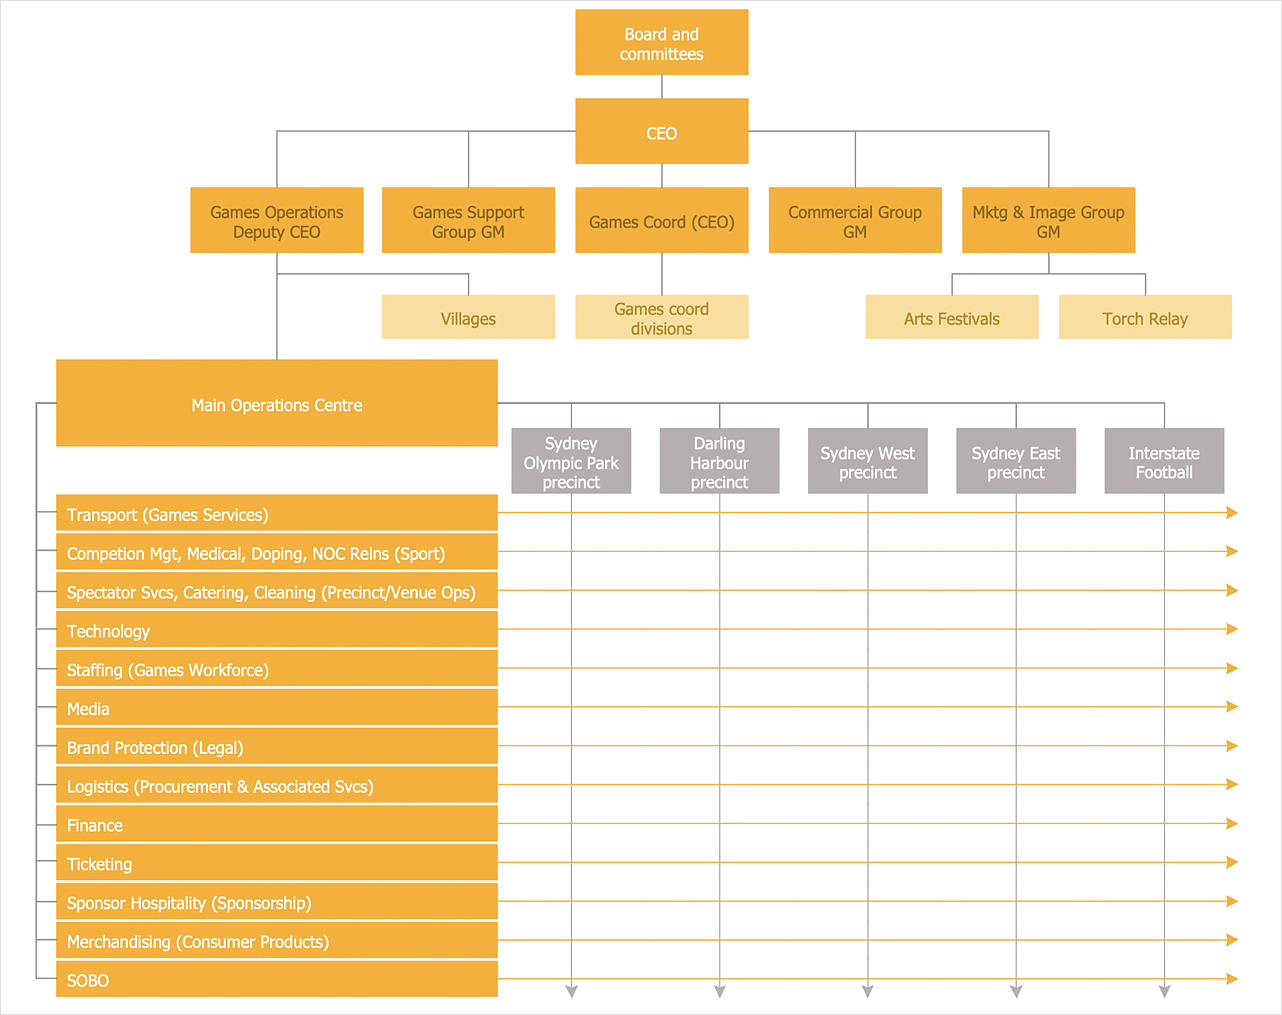
ConceptDraw DIAGRAM software is greatly powerful in many fields due to the large collection of provided solutions by ConceptDraw Solution Park, among them the cost effective Organizational Chart design capabilities. Organizational Charts Solution from the Management Area of ConceptDraw Solution Park perfectly suits for analyzing the organizational structures, visualizing and designing Organizational Charts for the companies of any sizes, for creation the hotel organizational chart, hospital organizational chart, corporate organizational chart, different flow charts, time lines, and much more. Organizational Charts Solution makes ConceptDraw DIAGRAM the perfect analyzer tool for managers and administrative staff. It offers plenty of useful and convenient tools for ConceptDraw DIAGRAM users, including the set of Organizational chart templates that make the process of creation Organizational Charts on their base easier and quicker, extensive Organizational chart library of tasks-specific symbols and shapes, helpful Organizational chart examples and samples.Total Quality Management with ConceptDraw
Total Quality Management (TQM) system is the management method where the confidence in quality of all organization processes is placed foremost. The given method is widely used in production, in educational system, in government organizations and so on.HelpDesk
How to Draw a Matrix Organizational Chart
There are a number of moments which are influenced on how the organizational structure of a certain business needs to be, how complex, and which type it should keep. The matrix organizational structure is atypical because it brings together employees and managers from different departments to work toward accomplishing a goal. This structure is commonly found in businesses that have more than one line of reportage. For instance, a company might contain an engineering department with engineering managers who workers report to. However, these workers might also have to liaise with different product or project managers depending on current tasks. Some form of matrix organization is found in most large-scale modern businesses. It is one of the most complicated reporting structures. You can easily build a clear matrix organizational chart in ConceptDraw DIAGRAM using templates from ConceptDraw Solution Park.Ice Hockey Diagram — Defensive Strategy — Neutral Zone Trap
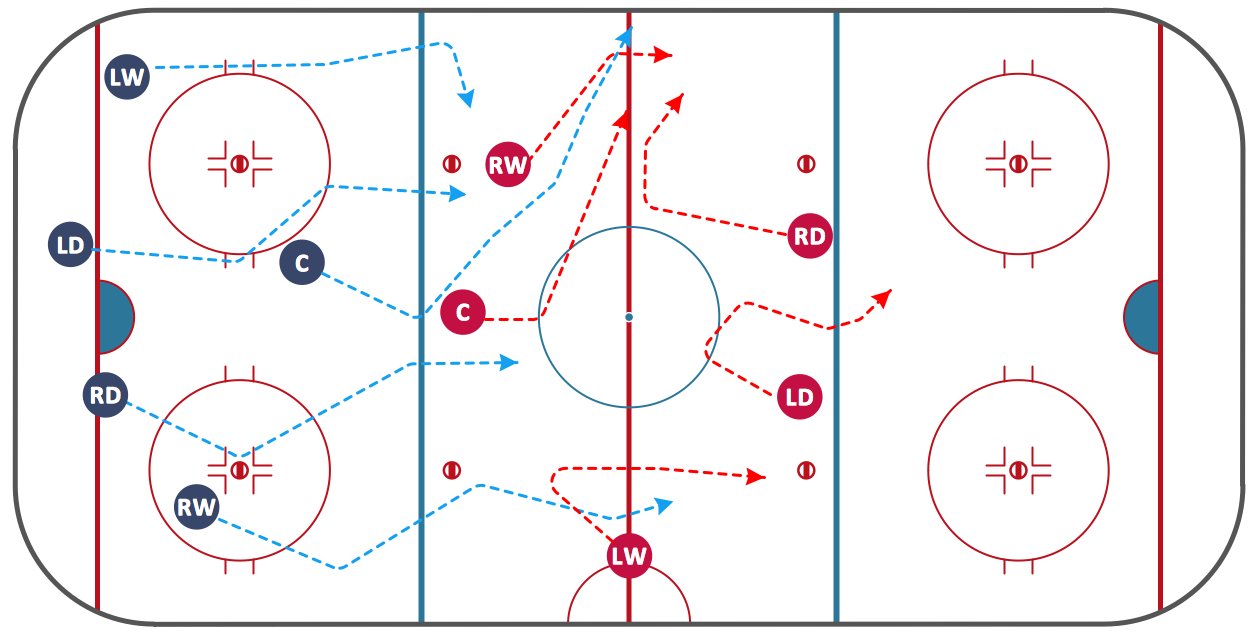
In ConceptDraw DIAGRAM you can produce ice hockey diagrams of any complexity for any presentaion needs, using a combination of tools. To adopt the sample below for presentation needs place positions and arrows onto different layers of your document and then make them visible one by one during a presentation.- 4 Level pyramid model diagram - Information systems types ...
- 4 Level pyramid model diagram - Information systems types | 5 Level ...
- Level Of Organization Chart
- Organizational Charts with ConceptDraw PRO | How to Draw an ...
- Organizational Structure | Active Directory Domain Services diagram ...
- Pyramid Diagram | Pyramid Diagram | Process Flowchart | Chart Of ...
- How to Draw a Hierarchical Organizational Chart with ConceptDraw ...
- 4 Level pyramid model diagram - Information systems types ...
- Systems Used By The Management Levels
- Organizational Chart Template | Organizational Charts with ...
- Organizational Chart Template | ConceptDraw PRO - Organizational ...
- Organisation Of Management Diagrams
- Organizational Chart Template | ConceptDraw PRO - Organizational ...
- Pyramid Diagram | Organizational Structure | 5 Level pyramid model ...
- UML Diagram | 4 Level pyramid model diagram - Information ...
- 4 Level pyramid model diagram - Information systems types ...
- Organizational Structure | IDEF0 Visio | Sales Process Flowchart ...
- Organizational Structure | Active Directory Domain Services diagram ...
- 4 Level pyramid model diagram - Information systems types ...
- 4 Level pyramid model diagram - Information systems types ...


