Scatter Graph Charting Software
ConceptDraw provides some interactive xy chart and scatter graph symbols that offers advanced features yet is simple to use.Scatter Plot
ConceptDraw PRO extended with Scatter Diagrams solution is ideal diagramming and vector drawing software for quick and easy designing professional looking Scatter Plot.How To use Landscape Design Software
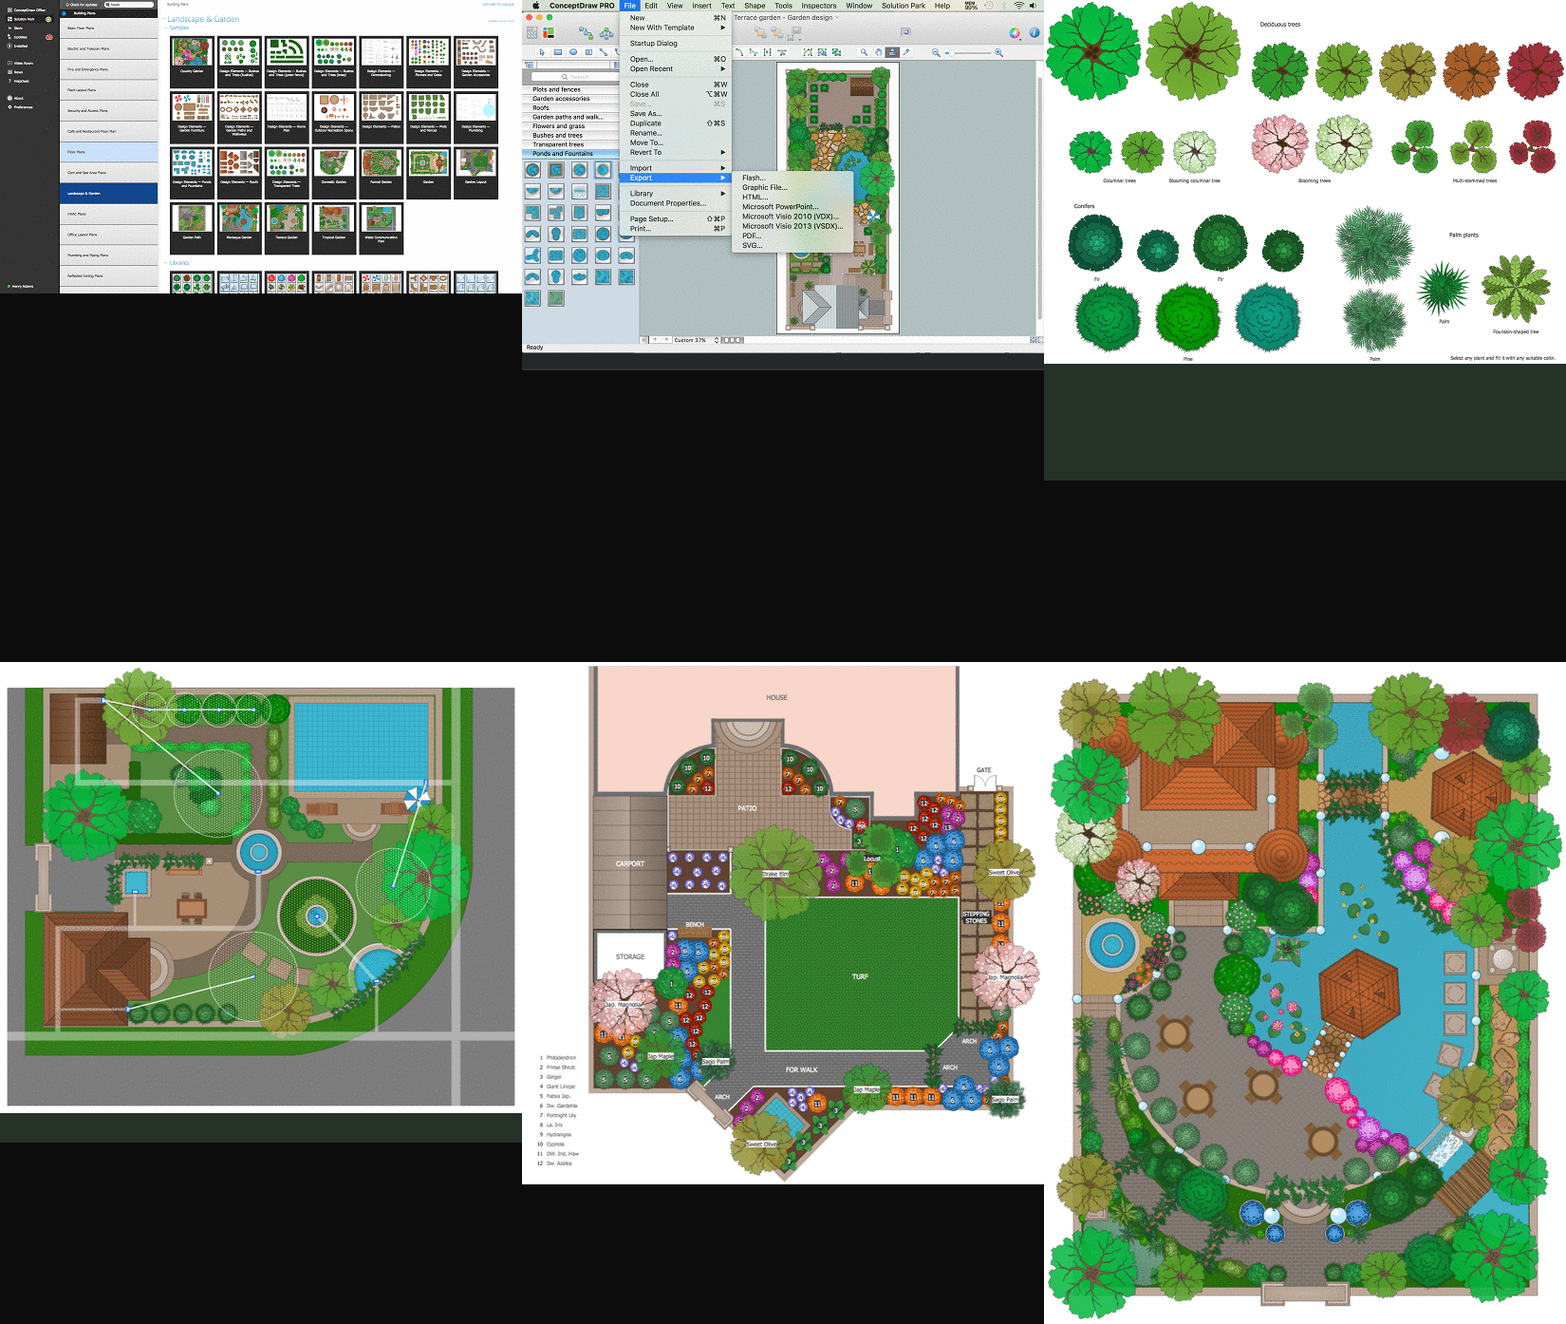
Creation great-looking or even impressive landscape designs is a great labour and real art. There are required the fundamental knowledge in design field, architecture and construction, and also in other special fields, such as plant growing, history, culture, philosophy, etc. Moreover, you need to have good artistic abilities for achievement success in landscape design. All these nuances create the impression that it is incredibly complex process, but ConceptDraw PRO aims to radically change your opinion and make you closer to the realization of your dream. Now thanks to the Landscape & Garden solution included to the Building Plans area of ConceptDraw Solution Park, you can fully concentrate on the creation the masterpieces in landscape design, without worrying about drawing process. Powerful drawing tools and included numerous collection of samples, templates and pre-designed vector objects are helpful for creation Landscape designs and Landscape plans of any complexity and style, they help you unlock your creativity and design easily the lively garden.Scatter Plot Graph
ConceptDraw PRO extended with Scatter Diagrams solution is the best diagramming and vector drawing software for quick and easy designing the Scatter Plot Graph of any complexity.Four Dimensions Bubble Plot
This sample was created in ConceptDraw PRO diagramming and vector drawing software using the Bubble Diagrams Solution from the "Diagrams" area of ConceptDraw Solution Park. This sample clearly shows the Four Dimensions Bubble Diagram of the distribution of chlorine contaminant in the water source. This Bubble Diagram is very useful in the chemistry, hydrology, and ecology.How To Create a Bubble Chart
Bubble diagrams solution extends ConceptDraw PRO software with templates, Using ConceptDraw Connectors, you can create a bubble chart in moments. Using ConceptDraw you will be able to create a bubble chart from the ready ConceptDraw library objects or make your own objects. The created diagram can represent ideas organization, in brainstorming processes, by teachers for explaining difficult ideas or for presentations.How To use House Electrical Plan Software
How we can conduct the electricity at house correctly without a plan? It is impossible. The House electrical diagram depicts locations of switches, outlets, dimmers and lights, and lets understand how you will connect them. But design of House Electrical Plan looks a complex task at a glance, which requires a lot of tools and special experience. But now all is simple with all-inclusive floor plan software - ConceptDraw PRO. As a house electrical plan software, the ConceptDraw PRO contains libraries with a large range of professional lighting and electrical symbols, ready-to-use electrical plans samples and examples, and built-in templates for creating great-looking Home floor electrical plans. It is a fastest way to draw Electrical circuit diagrams, Electrical wiring and Circuit schematics, Digital circuits, Electrical equipment, House electrical plans, Satellite television, Cable television, Home cinema, Closed-circuit television when are used the tools of Electric and Telecom Plans Solution from ConceptDraw Solution Park. Files created in Visio for Mac app can be easily imported to ConceptDraw PRO. Also you may import stencils and even libraries. Try for free an alternative to Visio that Apple users recommend.
Organogram Software
Organizing process is the process of creating the organizational structure of an enterprise. The organizing process consists of several stages. First, you need to divide the organization into departments, respectively to strategies, and then establish relationships of authority. After that, managing director delegates his rights and authorities.Blank Scatter Plot
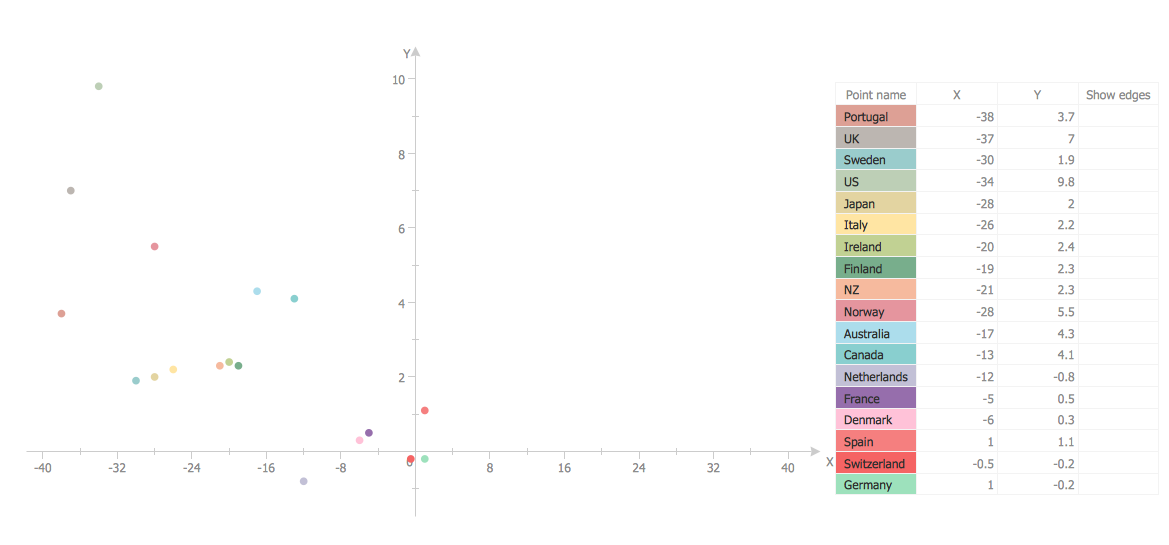
This sample shows the Scatter Plot without missing categories. It’s very important to no miss the data, because this can have the grave negative consequences. The data on the Scatter Chart are represented as points with two values of variables in the Cartesian coordinates. This sample can be used in the engineering, business, statistics, analytics, at the creating the financial and other types of reports.Site Plan Software
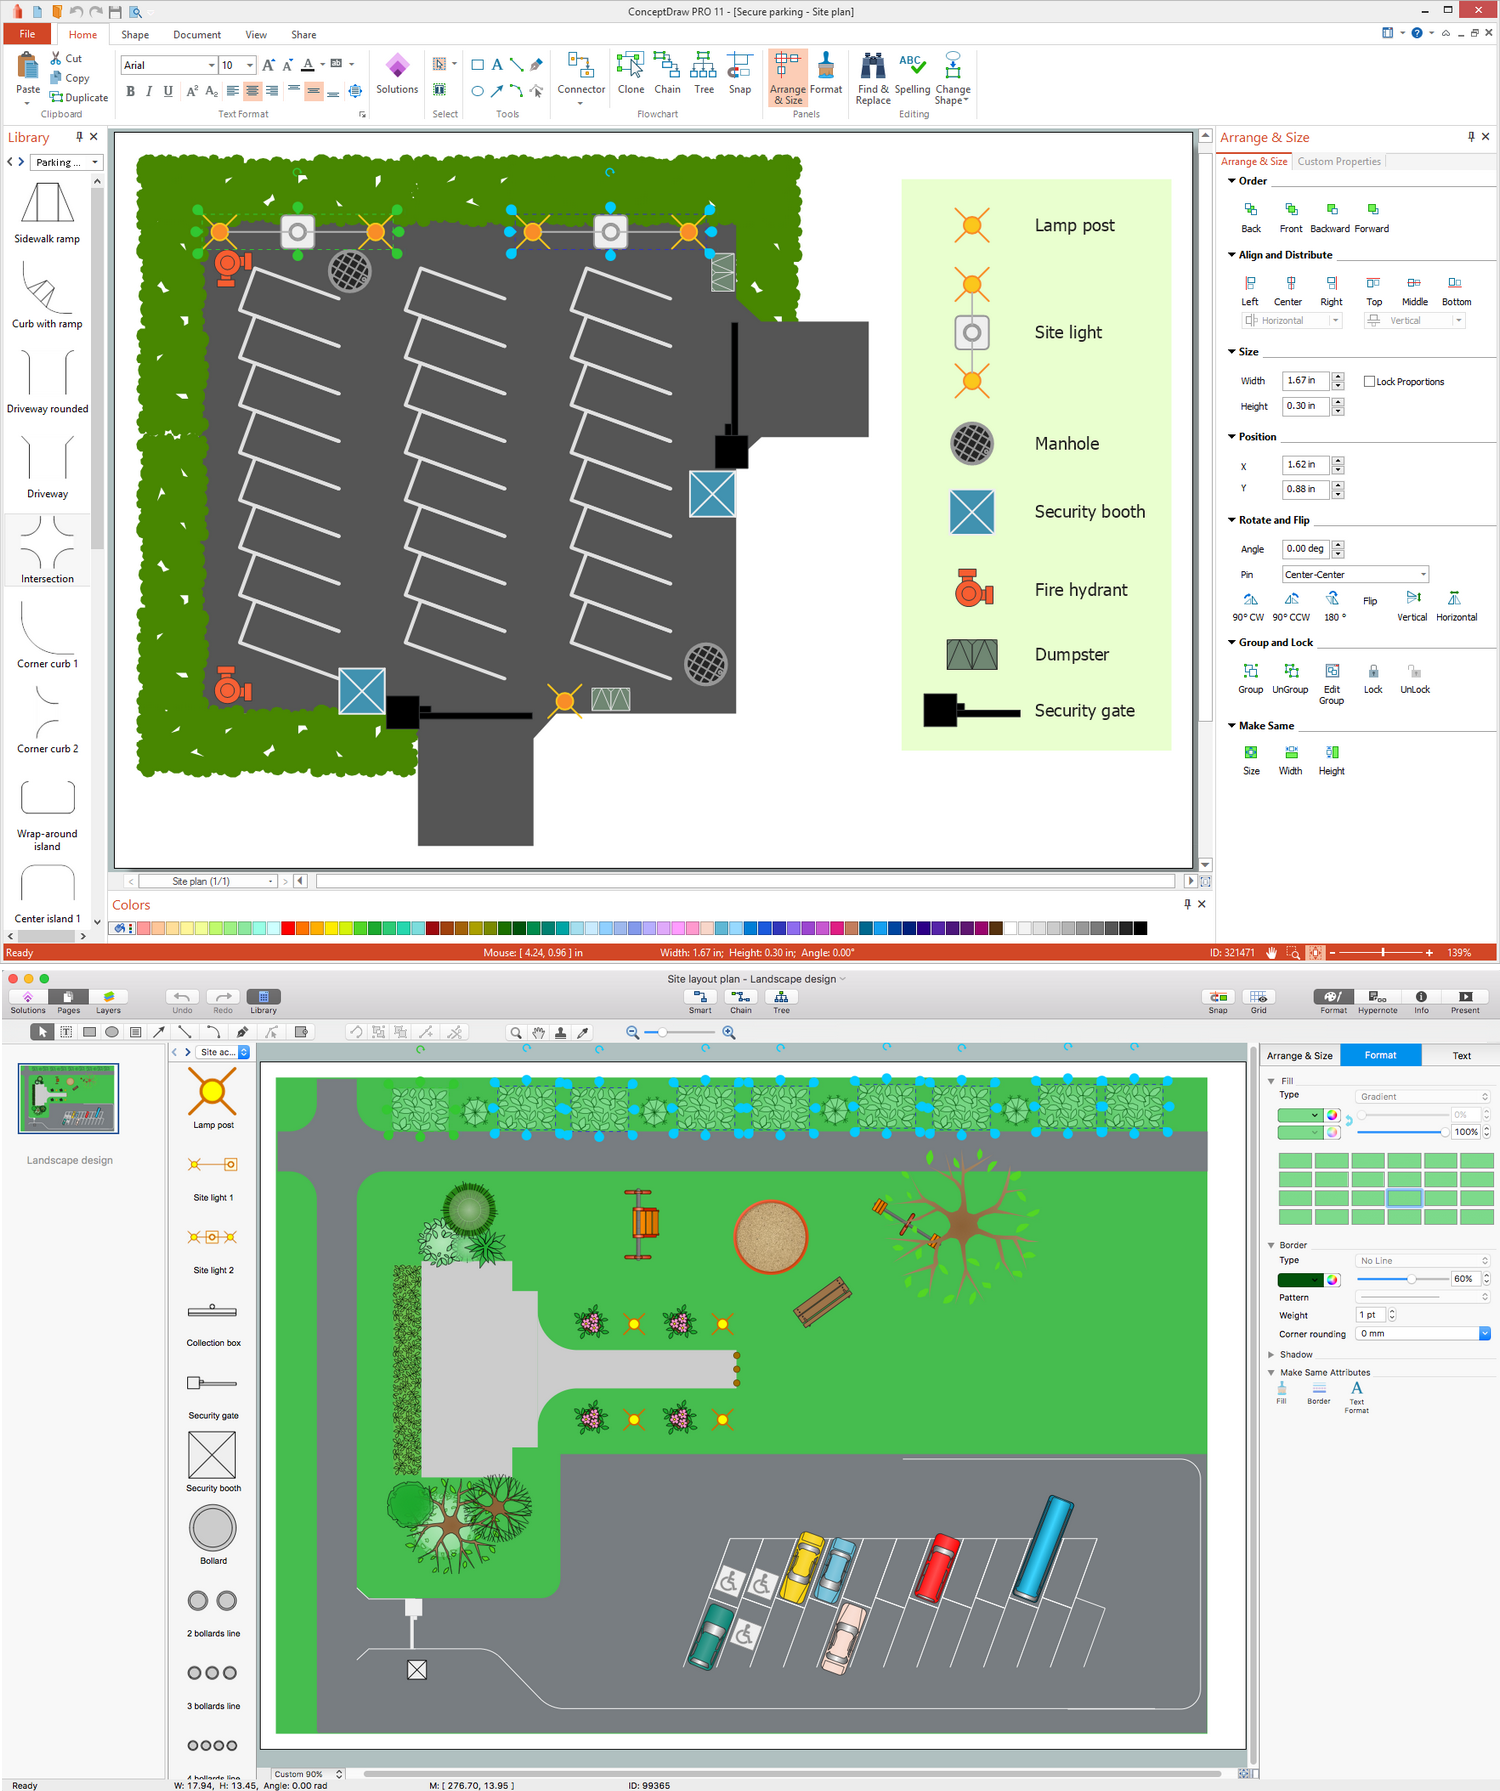
ConceptDraw PRO diagramming and vector drawing software extended with Site Plans Solution from the Building Plans Area of ConceptDraw Solution Park is a powerful Site Plan Software.- Plot Map Design Software Free Download
- Land Plot Layout Design Software
- Plant Layout Plans | Plot Design Software Free Download
- Plant Layout Plans | Plot Layout Design Software
- Design elements - Plots and fences | Plot Drawing Software
- Layout Plan For Plot With Drainage Details
- How To Draw A Plot Plan Free
- Plant Layout Plans | Plot Plan Software Free Download
- Design elements - Plots and fences | Beetles in the river Thames ...
- Design elements - Marketing charts | Scatter Chart Examples ...


