This site uses cookies. By continuing to browse the ConceptDraw site you are agreeing to our Use of Site Cookies.

Diagram Flow Chart

ConceptDraw DIAGRAM is a software for producing flow charts.

Venn Diagram Examples for Problem Solving. Computer Science. Chomsky Hierarchy

A Venn diagram, sometimes referred to as a set diagram, is a diagramming style used to show all the possible logical relations between a finite amount of sets. In mathematical terms, a set is a collection of distinct objects gathered together into a group, which can then itself be termed as a single object. Venn diagrams represent these objects on a page as circles or ellipses, and their placement in relation to each other describes the relationships between them. The Venn diagram example below visualizes the the class of language inclusions described by the Chomsky hierarchy.

Flow Chart Symbols

ConceptDraw DIAGRAM software extended with Flowcharts Solution from the "Diagrams" Area is a powerful software that will help you design the flowcharts for any business and technical processes, and software algorithms thanks to the predesigned flow chart symbols. Flowcharts solution offers 2 libraries with large collection of vector flow chart symbols: Flowchart Library, Flowcharts Rapid Draw Library that you can use to create your flowcharts quick and easy. Flowchart Solution is number of diagraming stencils including special set of flow chart symbols such as: terminator, process, decision which indicates a decision points between two or more paths in a flowchart, symbol of delay. Major symbols includes symbol of data, document or multiple documents, subroutine, preparation for processing of documents. Also includes symbols: display, manual input, manual loop, loop limit, stored data,connectors and suming junctions, sort and merge operations, symbols of database and internal stor

Venn Diagram Examples for Problem Solving

Venn diagrams are illustrations used in the branch of mathematics known as set theory. They show the mathematical or logical relationship between different groups of things (sets). A Venn diagram shows all the possible logical relations between the sets.

Design Element: Basic Network for Network Diagrams

ConceptDraw DIAGRAM is perfect for software designers and software developers who need to draw Basic Network Diagrams.

Local area network (LAN). Computer and Network Examples

Local Area Network (LAN) is a network which consists of computers and peripheral devices connected each other and to the local domain server, and covers a little territory or small number of buildings, such as home, school, laboratory, office, etc. LAN serves for few hundreds of users. It includes many cables and wires, and demands to design previously a Network diagram. All local area network devices can use the shared printers and disk storage. ConceptDraw DIAGRAM is a perfect network diagramming software with examples of LAN Diagrams, templates and predesigned vector objects. ConceptDraw DIAGRAM is the ideal choice for network engineers and network designers who need to draw fast and easy Local Area Network Diagrams, for IT specialists, developers and other IT professionals which need to visualize the communication schemes of LAN and visually document the LAN's physical structure and arrangement in houses, offices and other buildings. Ready-to-use vector objects from Computer Network Diagrams solution will help you design LAN diagrams in minutes.
How to Draw a Computer Network

Program Structure Diagram

Program Structure Diagram - The Software Development solution from ConceptDraw Solution Park provides the stensils libraries of language level shapes and memory objects for drawing the structural diagrams of programs and memory objects using the ConceptDraw DIAGRAM diagramming and vector drawing software.

Context Diagram Template

This template shows the Context Diagram. It was created in ConceptDraw DIAGRAM diagramming and vector drawing software using the Block Diagrams Solution from the “Diagrams” area of ConceptDraw Solution Park. The context diagram graphically identifies the system. external factors, and relations between them. It’s a high level view of the system. The context diagrams are widely used in software engineering and systems engineering for designing the systems that process the information.

flow chart software, flowchart maker, flowchart, flow chart Flowcharts

flow chart software, flowchart maker, flowchart, flow chart
The Flowcharts solution for ConceptDraw DIAGRAM is a comprehensive set of examples and samples in several varied color themes for professionals that need to represent graphically a process. Solution value is added by the basic flow chart template and shapes' libraries of flowchart notation. ConceptDraw DIAGRAM flow chart creator lets one depict the processes of any complexity and length, as well as design the Flowchart either vertically or horizontally.

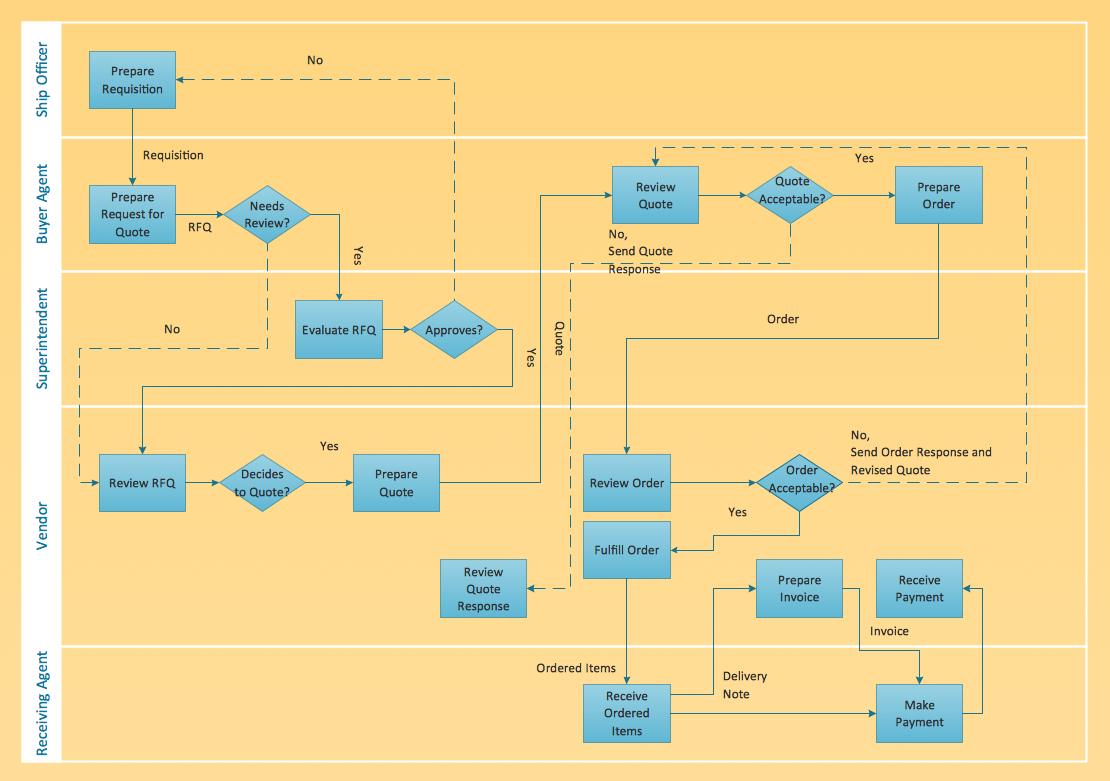
Cross Functional Flowchart for Business Process Mapping

Start your business process mapping with conceptDraw DIAGRAM and its Arrows10 Technology. Creating a process map, also called a flowchart, is a major component of Six Sigma process management and improvement. Use Cross-Functional Flowchart drawing software for business process mapping (BPM). Use a variety of drawing tools, smart connectors and shape libraries to create flowcharts of complex processes, procedures and information exchange. Define and document basic work and data flows, financial, production and quality management processes to increase efficiency of you business.

Venn Diagram Examples for Problem Solving. Environmental Social Science. Human Sustainability Confluence

The Venn diagram example below shows sustainable development at the confluence of three constituent parts. Create your Venn diagrams for problem solving in environmental social science using the ConceptDraw DIAGRAM diagramming and vector drawing software extended with the Venn Diagrams solution from the area "Diagrams" of ConceptDraw Solution Park.

Containment and Cross-Functional Flowcharts

The Cross-Functional Flowchart template is available in ConceptDraw DIAGRAM Template library. In the File menu -> Template Galery -> and then choose Cross-Functional Flowcharts. If you demand more, try its 2 libraries and 45 vector shapes of the Cross-Functional Flowcharts solution. Use cross-functional flowcharts to show the relationship between a business process and the functional units (such as departments) responsible for that process.

Illustrate the Computer Network of a Building

With best content of the Wireless Network solution that includes more than 10 building pre-designed objects network engineers can illustrate the computer network of a building.

Professional Diagram and Flowchart Software

ConceptDraw DIAGRAM is a Mac OS X and Windows platforms professional software to draw your own business process diagrams and flowcharts.

3 Circle Venn. Venn Diagram Example

This example shows the 3 Circle Venn Diagram. The Venn Diagrams visualize all possible logical intersections between several sets. On this example you can see the intersections of 3 sets. Venn Diagrams are widely used in mathematics, logic, statistics, marketing, sociology, etc.